UK inflation eases again
Making sense of the latest trends in property and economics from around the globe.
3 minutes to read
UK inflation
The UK's consumer price index (CPI), the key measure of inflation, rose 10.1% during the year to January, according to official figures out this morning. That's down from 10.5% in the year to December and represents the third consecutive month of easing.
Air and coach travel, petrol prices and restaurant, cafe and takeaway prices all eased, bringing the figure below economists’ expectations and broadly in-line with Bank of England forecasts published last month. Pay data published yesterday is also moving in the right direction.
It's a long way back down to the 2% target, but so far so good. We'll look at how markets reacted and the likely implications for mortgage rates, if any, on Friday.
US inflation
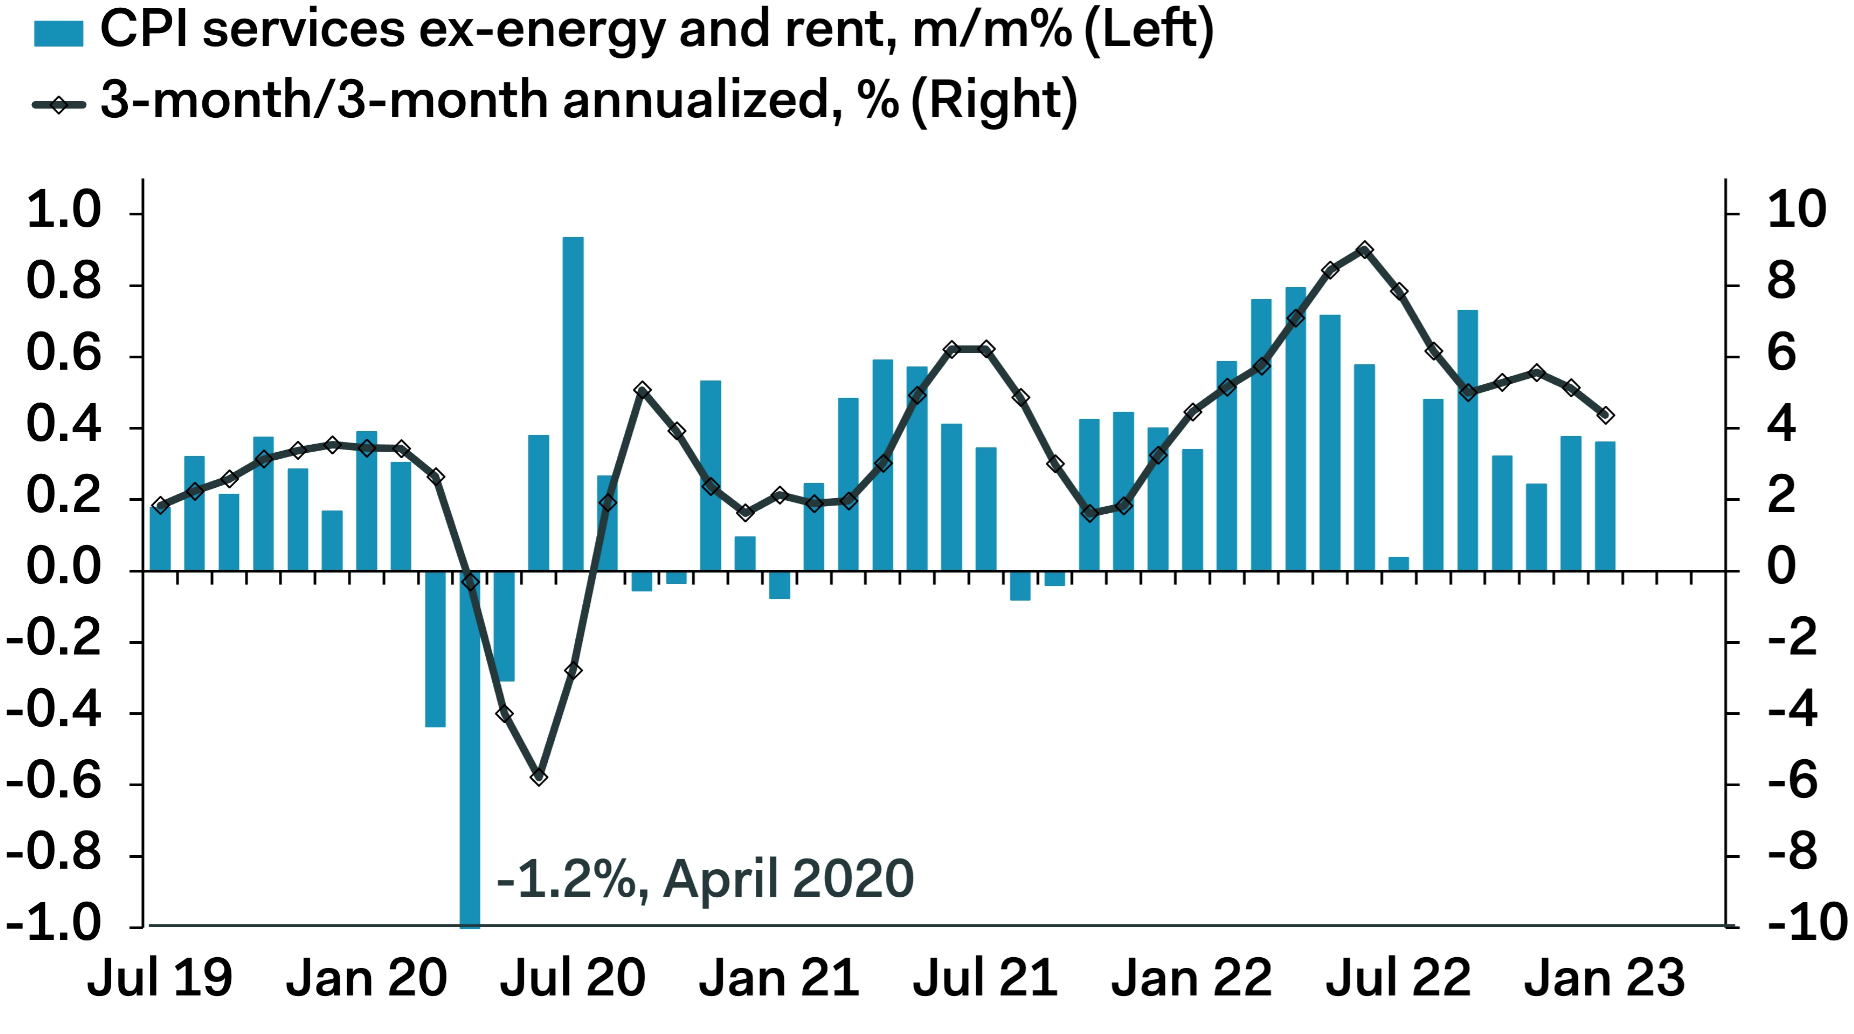
Tuesday's US CPI report was a messier affair. Consumer prices climbed 6.4% in January from a year earlier, a slight slowdown from the previous month but above economic consensus.
The broad trend is positive, see chart below courtesy of Ian Shepherdson at Pantheon Macroeconomics. However, a 'blowout' jobs report earlier this month and sticky looking core goods prices have rattled some Fed officials, several of whom took to TV studios in the wake of the decision to make clear that the key interest rate will need to clear 5% by the end of the year. Just two weeks ago, investors had been betting that rates would close the year lower than its current range of 4.5% to 4.75%.
That may dampen what is becoming a solid turn in sentiment underway in the housing market. Demand for mortgages is back on an upward trend. Forecasters including Goldman Sachs have largely ruled out a double digit price correction. Indeed, mortgage rates ticked up slightly last week in the wake of the strong jobs report following weeks of declines.
Prime cities
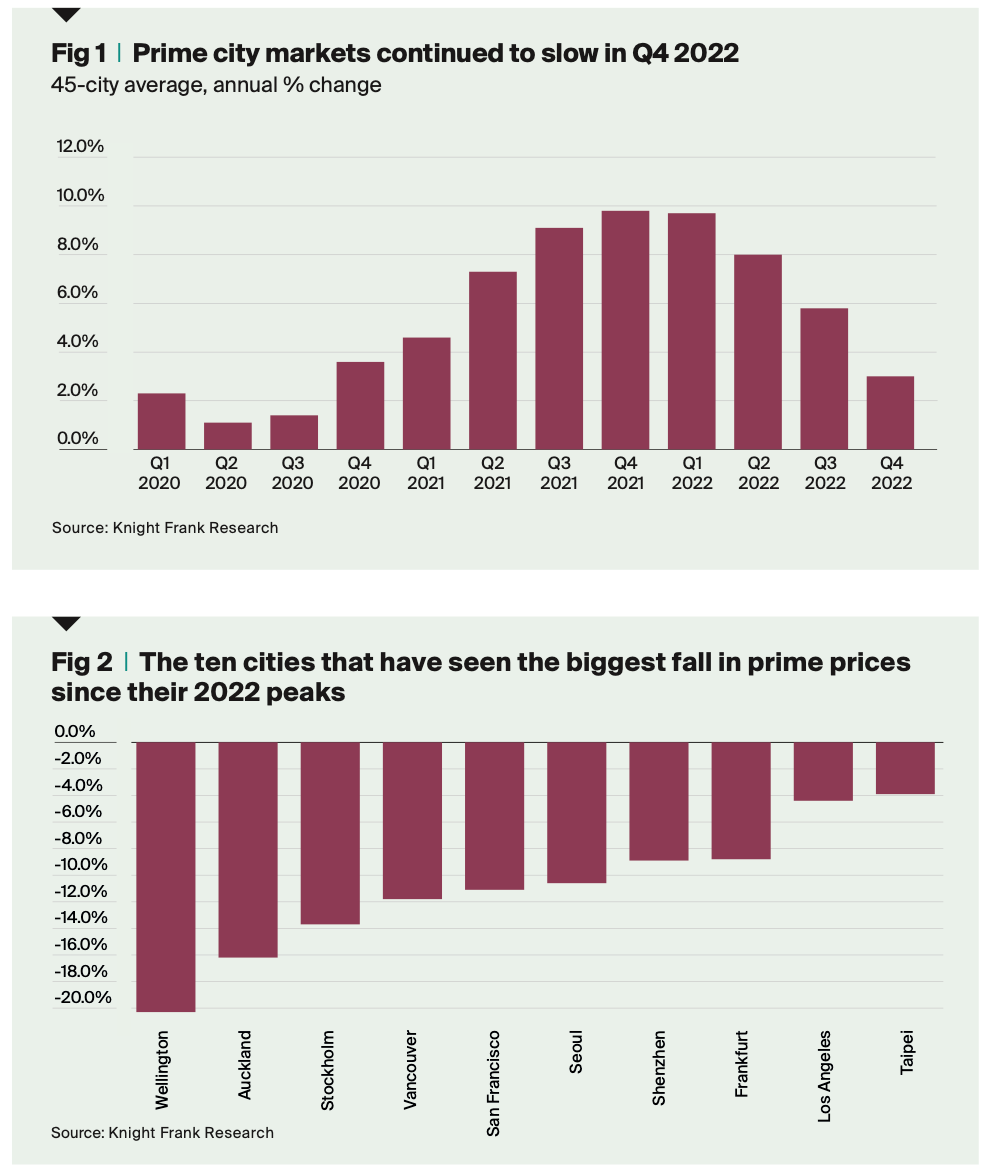
The impact of higher interest rates is being felt in housing markets around the world. Our Prime Global Cities Index, which tracks the movement of prime prices across 45 cities, climbed 3% during the year to Q4 2022, down from a peak of 10% in the year to Q1 2022.
For the first time in seven consecutive quarters, annual growth has fallen below the index’s average five-year growth rate of 4.3%, and the number of cities registering year-on- year price falls has increased from seven in Q3 to 12 in Q4.
Although more insulated than the wider housing market, some prime residential markets are being affected by weaker buyer sentiment caused by mounting economic headwinds. Wellington, Auckland, Stockholm, Vancouver and San Francisco have witnessed some of the strongest price falls from their 2022 peaks - see chart 2.
Flats are back
Apartments are back in demand in prime central London amid the return of overseas buyers. Three quarters of homes sold during Q4 were flats, the highest level in three years, Knight Frank and LonRes data shows.
The change has benefitted markets where apartments are more prevalent. The strongest annual price growth in PCL in the year to January 2023 was in South Kensington (+5.5%) followed by Knightsbridge (+4.5%).
“Returning international buyers can see there has been very little change in prices over the last two to three years and that is driving demand for flats,” says Stuart Bailey, Knight Frank's head of prime central London sales. “Buyers are particularly motivated in more central areas and at higher price points.”
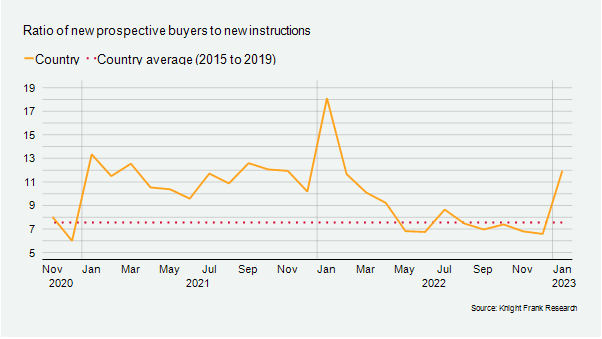
Meanwhile, the new year rebound in housing market activity that we've explored in recent notes extends to the UK country market. The ratio of new buyers (demand) to new instructions (supply) in the UK (excluding London) reached 12 in January, the highest it has been in the past year (see chart). You can read more here.
In other news...
Commercial flights reach pre-Covid levels (Javier Blas via Twitter), regions with easier commutes lead office return (Times), and finally, turning offices into condos: New York after the pandemic (FT).