UK Property Market Outlook: 28 May 2021
Supply and demand distortions are affecting many areas of the economy, including the housing market. There are signs more balance is returning.
2 minutes to read
What do a pair of shoes, a tank of petrol, a restaurant manager’s salary and UK house prices have in common?
The answer is they are all currently subject to inflationary pressures due to the disruptive impact of the pandemic.
Supply chain shortages, surging demand and changes to seasonal patterns of behaviour all played their part as UK inflation more than doubled to 1.5% in April.
Temporary mismatches between supply and demand are not new. As the UK came out of the global financial crisis, inflation edged above 5% in September 2011. A year later it was a little over 2%.
At the time, the Bank of England said what it is saying now – inflationary pressures will be short-lived and recede as more balance returns between supply and demand.
House price inflation has been a feature of the economy as the third national lockdown lifts. Annual UK house price growth in the year to March reached 10.2%, according to the ONS, which was the highest figure since August 2007.
Indeed, more money was spent in the housing market in England and Wales in the year to March than any 12-month period since before the global financial crisis, an analysis of residential transactions shows.
Demand has sprung back since the pandemic as people have reassessed how and where they live, a trend that has benefitted locations with more space and greenery. The Bank of England has estimated that people have saved £203 billion over the course of the pandemic.
In the housing market, the budget of all new prospective UK buyers registering with Knight Frank in the year to April was £123.8 billion, which was the highest figure in 20 years.
However, supply is also getting stronger, which indicates house price inflation will cool in the second half of the year. Knight Frank forecasts UK prices will grow by 5% in 2021.
Supply in the first two months of the year was curtailed by the pandemic. Uncertainty over Covid-19 variants, the constraints of home-schooling and a belief the original March stamp duty deadline would be missed all suppressed new listings, which typically spike after Christmas.
In the first eight weeks of this year, the number of market valuation appraisals, which is a leading indicator of supply, was at its lowest level in six years and 38% below the equivalent period in 2016, as the chart below shows.
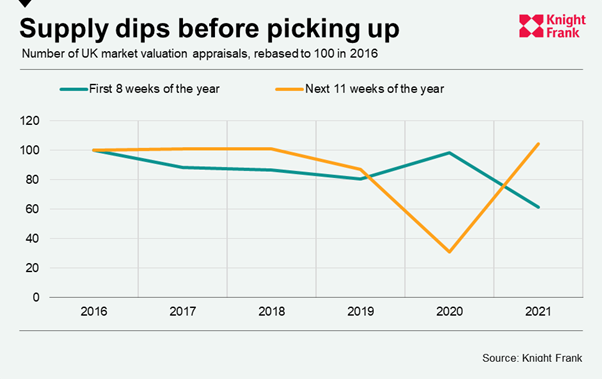
However, in the following 11 weeks, a period that runs until mid-May, the number reached its highest level in six years and was up by 5% on 2016.
It points to the return of a more balanced market and, eventually, reduced upwards pressure on prices.
Photo by NeONBRAND on Unsplash