Industrial Land Values – Q3 2022 Update
Rising build costs, along with lower capital values and downward revisions for growth have depressed land values.
4 minutes to read
Industrial land values across the UK have fallen -35% on average over the past six months. There has been positive rental growth however, which has cushioned the fall in land values.
It should be noted that these land values are calculated on an appraisal basis and do not necessarily reflect sale prices. The rapid fall in what buyers are willing to pay for land has not necessarily been met with seller’s pricing expectations and therefore transactions have slowed and transactional evidence of land pricing is relatively weak at present.
Pricing shifts and changing growth expectations have also made development unviable in some markets and therefore appetite to purchase land for development has waned.
Although industrial land values have recorded negative growth the last six months, this should be viewed alongside the strong performance over the past three years. As our report earlier this year determined, industrial land values rose 163% over the past three years (Q1 2019-Q1 2021).
All regions recorded a fall in land values, though Greater London held up best, recording a regional decline of just 12%. The London Borough of Brent performed best over the period, with land values dipping just 3%, followed by Wandsworth and Merton, where values declined 5%, and Ealing with a 6% drop. The London Borough of Bexley, which recorded exceptionally strong growth in the three years to Q1 2022, recorded a 19% decline over the last two quarters. Within London, Bromley saw the largest decline, with land values down 20% on Q1 2022.
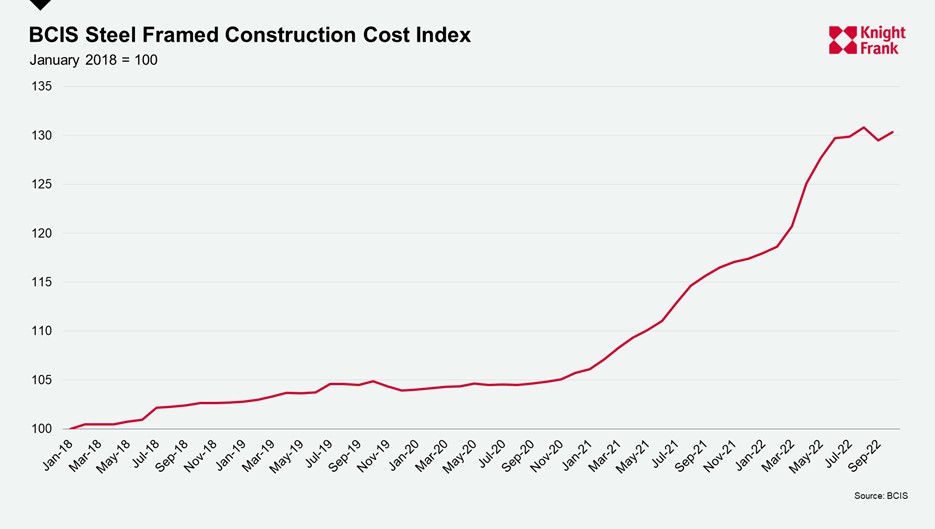
Inflationary pressures have continued to drive up build costs over the past six months, which has had a negative impact on land values. As developers’ costs rise, the price they are willing to pay for land falls. The cost of steel frame construction has risen sharply since the end of Q1, increasing 7.3% over the last 6-months (BCIS).

While the increases in build costs have been relatively uniform across the country, rental and capital value growth has not. Both historic and forecast growth tends to be weaker in more peripheral markets. These peripheral markets also tend to have lower rents and capital values and are therefore less able to absorb the rise in build costs. As a result, development is no longer viable in some markets.
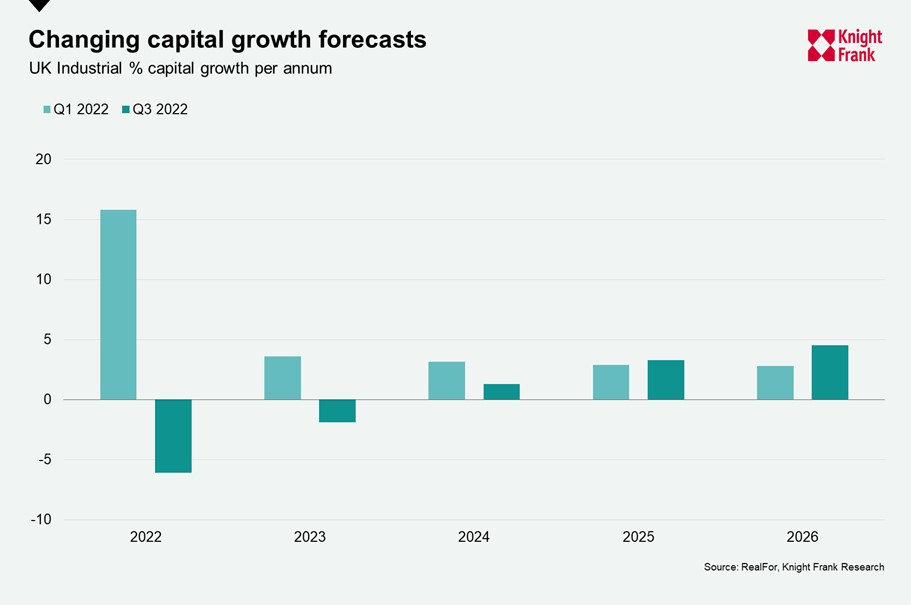
Another factor driving down land values has been a softening in the capital values for industrial units. Expectations for growth this year, and over the next two (2023-24) years have been revised down across all markets. In Q1 2022, average capital values for UK industrial were forecast to increase 15.8% this year (2022), with a further 3.6% growth expected in 2023. These forecasts were revised down in Q3 2022, with negative growth of -6.1% now expected this year, followed by -1.9% in 2023, before positive (albeit marginal) growth returns in 2024.

Markets with the largest expected declines in capital values correspond closely with those that have recorded the largest declines in land values (according to our model). However, not all markets are forecast to see negative capital value growth.
While capital values across London are forecast to dip -6.7% this year, Ealing is expected to see growth of 3.5%, and Enfield 3.3% (RealFor). While the East Midlands is expected to record negative growth of -3.6% this year, Leicester is forecast for 5.7% growth (RealFor).
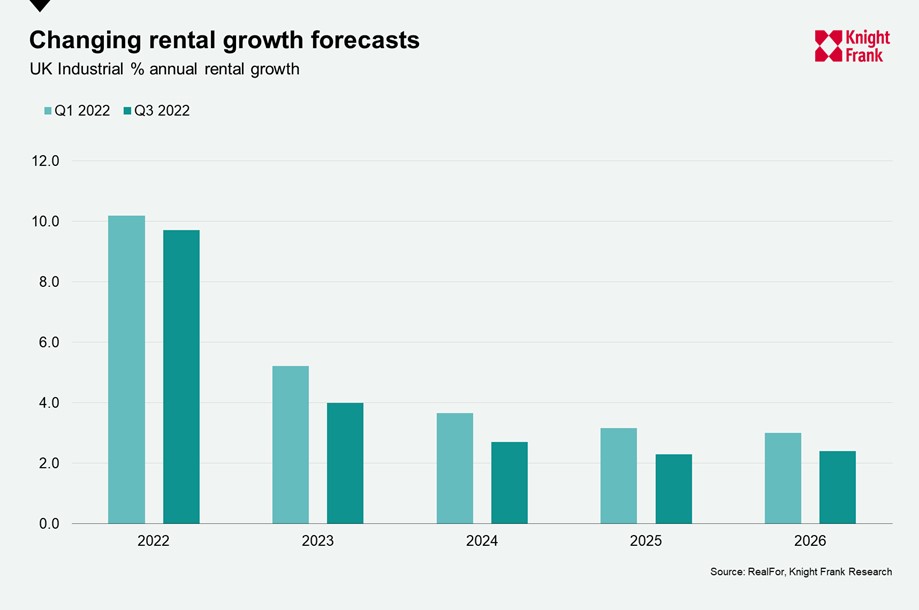
Rental growth forecasts have also been revised down over the past six months, though the differences are marginal. In Q1 2022, average rental growth for UK industrial was forecast at 10.2% this year, with a further 5.2% growth next year.
In Q3 2022, the expectations were for growth this year to reach 9.7%, with 4.0% growth expected next year. While most markets have seen a downward revision, rental growth has been stronger than anticipated in the West and East Midlands as well as in the South West regions and expectations for growth this year have been revised up.

Though the model does not account for a change in developers’ attitude to risk, the assumptions around voids or rent free periods could be adjusted. Currently the model accounts for a void/rent-free period of 12-months. Occupier demand remains robust and there is no evidence that incentives or void periods are increasing.
Indeed, the average rent free period for leases agreed in Q3 2022 was 9.8 months, down from 11.0 months in Q1 2022. If the rent free period was extended to 18-months, this would result in a further -8% fall in average land values, meaning land values would be 40% lower than in Q1 2022.
With revised forecasts, for build costs, rents and capital value growth, the outlook for land values has also changed. Over the next three years (to Q3 2025), UK industrial land values are forecast to remain fairly stable, with -2.2% growth anticipated, with very little capital growth expected and rental growth largely offsets the forecast rise in build costs.
There is a great deal of uncertainty around future land values however, due to the number of variables, including rental growth and capital growth forecasts, build cost forecasts and the potential for shifts in the occupier market that may lead to void periods and higher incentives being offered.