Which UK areas have lowest levels of mortgage debt and are most resilient to interest rate hikes?
High levels of equity and low levels of debt mean that some parts of the country will be naturally more insulated from rising mortgage costs than others.
3 minutes to read
It is widely accepted that changes in the cost and availability of mortgage debt are going to put downwards pressure on house prices in the coming months.
Our forecasts are for house prices to fall by 5% next year and in 2024. This would represent a total decline of almost 10% and takes house prices back to the same level as last summer.
Of course, different markets and buyer types will be impacted in different ways. Anyone coming to the end of a fixed-rate term, or buyers with a lapsing mortgage offer, are at the sharp end of what is taking place. Equally, cash buyers and those using low levels of debt will be comparatively less exposed to the vagaries of the mortgage market, something my colleague Tom Bill has explored previously.
Regulations introduced since the global financial crisis have also kept higher loan-to-value lending at sensible levels, while high house price growth in the past has meant existing homeowners will have built a healthy buffer of equity.
Indeed, according to our calculations, the total value of privately owned homes across England and Wales now stands at £8.4 trillion. Outstanding mortgage debt, meanwhile, is around £1.6 trillion, which equates to around 20% of total housing value. The presence of high levels of housing equity and relatively low levels of mortgage debt nationally ultimately means that a large portion of the market is less exposed to higher borrowing costs and should have some in-built resilience to wider economic turmoil.
But this figure is not distributed evenly across the country. UK Finance data suggests there are just under 11 million mortgages outstanding across the country, out of 24.8 million households. That suggests average outstanding mortgage debt of around £150,000 per mortgaged household.
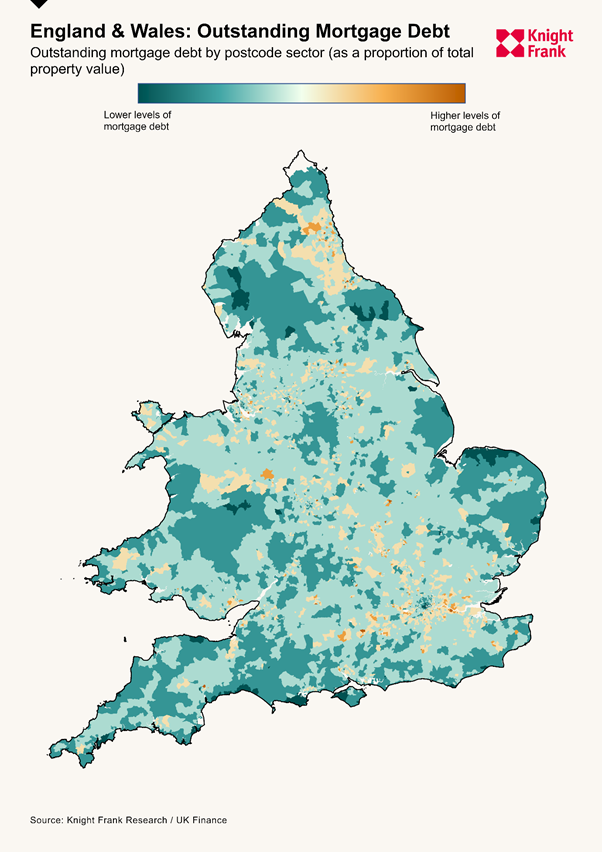
To understand what that might look like locally, we have mapped data on outstanding mortgage balances at a postcode level relative to housing value. Dark green areas are those with lower levels of debt and higher levels of equity. The markets with the lowest levels of mortgage debt are a combination of affluent London boroughs and more rural areas with older populations who are likely to have paid down the bulk of their mortgage debt.
Prime London resilience
Our forecasts point to prime markets outperforming in terms of price growth over the next five years. Indeed, we expect prices to fall by 3% next year in PCL before rising modestly in subsequent years. The relative value in prime central London compared to the previous market peak in 2014 will underpin an overdue recovery in the medium term, while the market will also be supported by higher levels of affluence and housing equity.
Knight Frank sales data for the first nine months of 2022 suggests that the percentage of cash buyers in PCL was 52%. This is supported by the lending data, with central London postcodes in Kensington & Chelsea and Westminster some of the least indebted relative to underlying housing value, as shown on the map below.

What does it mean for the housing market?
Whilst undoubtedly there will be pressure on prices over the next 12 to 24 months, the picture is clearly nuanced. High levels of equity and low levels of mortgage debt in many markets provide a buffer and will limit the kind of price falls seen in the wake of the global financial crisis.
The net result is instead likely to be fewer transactions as discretionary buyers and sellers put plans on hold while the market and economy stabilises, and as would-be first-time buyers remain in the rental market for longer. The prospect of an even deeper pool of renters is one reason we upgraded our forecasts for rental growth last month.