UK housing market falters due to protracted period of price discovery
Latest positive house price data adds to confusing picture in a low-volume market.
2 minutes to read
The Nationwide and Halifax both reported an unexpected house price rise in October.
A monthly increase of 1.1% meant the annual decline recorded by Halifax narrowed to -3.2% while Nationwide published almost identical numbers.
Confusingly, this could be interpreted as a sign of strength or weakness.
More clarity will emerge in coming months, but for those whose glass is half-full, it shows how demand and activity are picking up. Could this be the fabled bottom of the market?
It is an event normally only seen in the rear-view mirror, but it could be. However, last month’s surprise increase could also be the symptom of a weak market.
Both indexes may be volatile due to smaller sample sizes. They may simply reflect the fact that sales volumes are currently low compared to recent years. It’s a theme we explored in more detail here.
Frustratingly, it wouldn’t be sensible to jump to a firm conclusion this side of Christmas.
Either way, there tends to be an overreliance on house price movements when assessing the health of the market. Falling house prices do not necessarily indicate a weaker pulse and vice versa.
The UK housing market is going through a period of ‘price discovery’ as rates normalise after 14 years. Uncertainty over what the Bank of England does next, an approaching general election, and the impact of overseas military conflicts on sentiment are protracting this process.
It means the number of UK mortgage approvals was more than a third below the five-year average (excluding 2020) in September and transaction volumes were down by just under a quarter. These two statistics tell the story of the current downturn, as the chart shows.
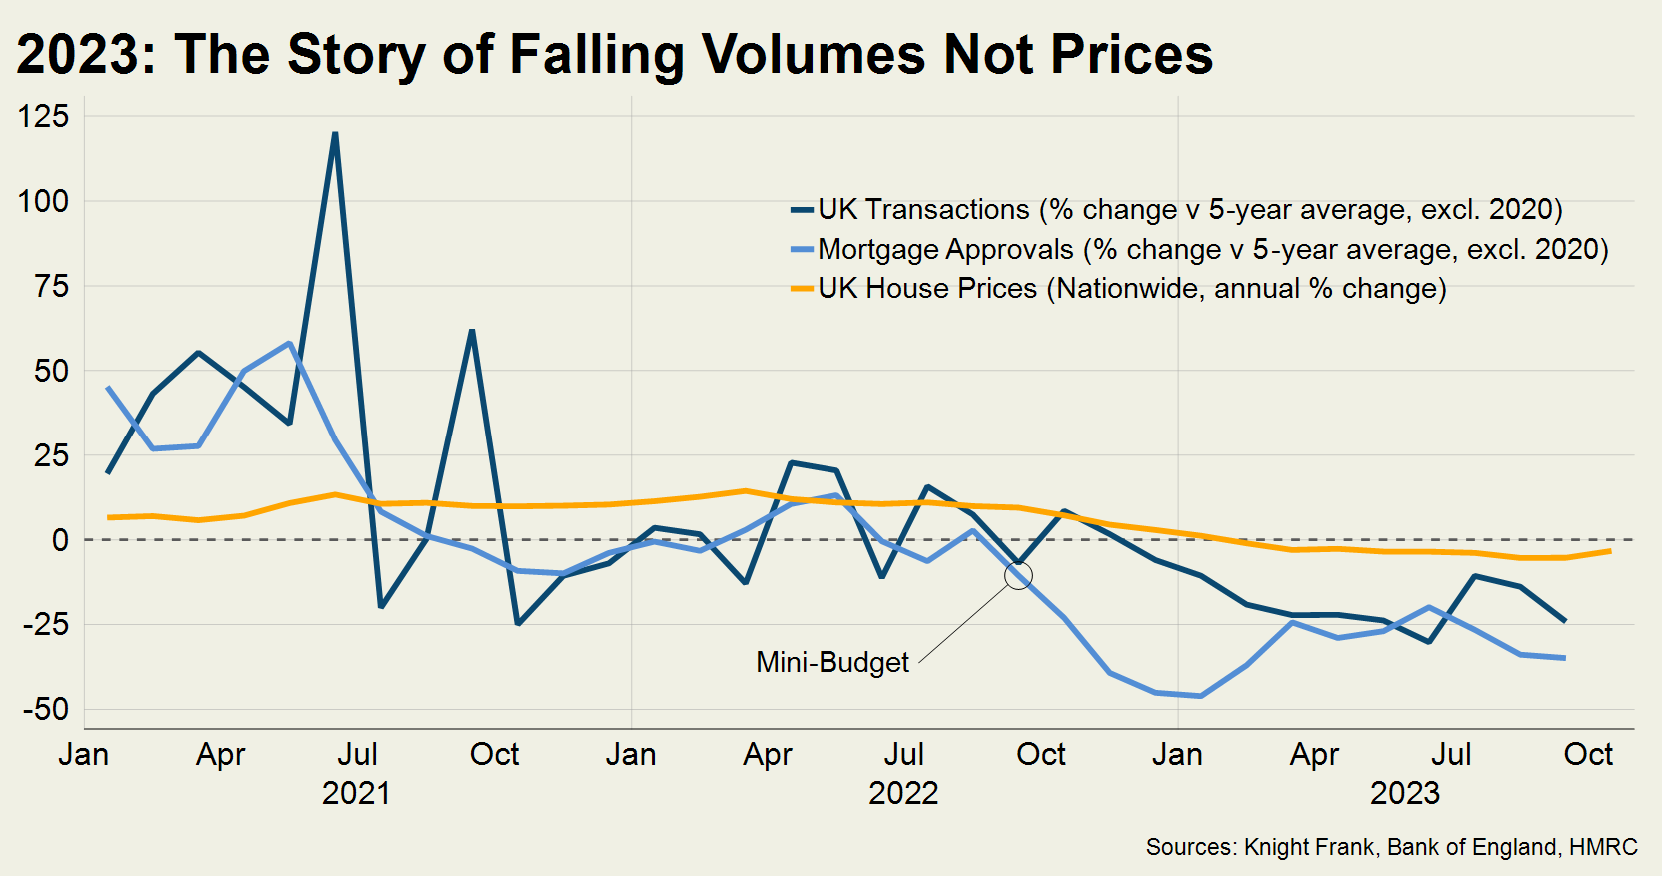
Meanwhile, the Nationwide house price index has not moved more than six percentage points either side of zero for a year.
Compare that to February 2009, when an annual fall of 18% was recorded as the weak financial position of lenders resulted in forced selling, something that has not resurfaced in a meaningful way this year.
The chart also demonstrates how the housing market was shaken by the mini-Budget, stabilised for several months under a new Prime Minister but has more recently faltered due to stubborn inflation, as we analysed in more detail here.
As buyers and sellers both hesitate, volumes have slowed more than prices.
House prices affect wider sentiment and inform the thinking of anyone buying or selling but arguably their biggest importance to the economy is in enabling a liquid housing market.
The number of cars sold (new and second-hand) is a more informative statistic for UK PLC than the price they are trading at, for example.
For every 100,000 houses sold, there is a net contribution of £956 million to GDP, a Knight Frank study found in 2020.
We will find out in next week’s Autumn Statement whether the government has a plan to support this key sector of the economy.