60 Second Property Digest – UK residential development land index
The first in a series, David Chapman, senior research analyst, sums up the latest findings from the residential development Land index Q2 2022.
2 minutes to read
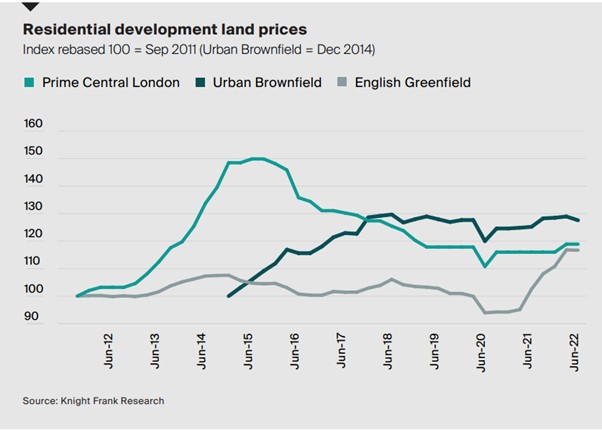
Knight Frank’s Residential Development Land Index tracks the performance of residential land values across Prime Central London and England each quarter.
David explains why development land shortages across the country are supporting prices, what types of development land have seen price growth and what the latest housebuilder and developer survey revealed.
Development land shortages across the country are supporting prices, but the market is expected to come under pressure later this year as house price inflation cools and build costs continue rising.
Average land prices in prime central London rose 2.5% on an annual basis, but were unchanged from Q1 2022. Last quarter, land values in PCL rose for the first time since autumn 2020, boosted by a stronger PCL sales market and an increase in international demand as covid-related travel restrictions continue to ease globally.
Annually, greenfield values increased 13.9%. While demand has been exceptionally strong for housing-led greenfield site, Elsewhere, brownfield land prices were down -1.1% in Q2 but remain 1.9% higher compared to a year ago. There has been a slight uptick in demand for urban flatted schemes as commuters return to office working.
Housebuilder and developer survey
Our latest survey of housebuilders and developers found that build costs have had a ‘significant’ impact on 48% of respondents’ businesses in Q2, up from 44% in Q1, with a third reporting a ‘moderate’ impact.
Looking ahead, 43% of respondents believe ‘build cost inflation’ and ‘supply chain disruption’ will continue to have the biggest impact on the sector in Q3, with a fifth citing planning delays as another key issue.
Overall, 74% of survey respondents said they were open to buying all types of land, including strategic land, with the remainder seeking land allocated in local plans (11%), land with outline planning consent (11%) or land with detailed planning consent only (4%).