Brexit six years on: assessing the impact on UK housing
What do transaction numbers, prices and other indicators tell us about the post-Brexit landscape in the UK property market?
5 minutes to read
Thursday this week marked six years since the UK voted to leave the EU on June 23rd 2016.
In the heat of a divisive campaign, the government said house prices could fall by 18%, half a million jobs may be lost, and foreign buyers would turn away from the UK if the country voted to leave.
The reality proved to be far more prosaic. Prices defied the negative predictions and did so again four years later when economists warned of a 20% decline as the pandemic took hold.
Logistical hurdles caused by Brexit mean there have been supply chain and labour market disruptions that have affected the housebuilding sector, in many cases compounded by the pandemic.
But what do the numbers tell us about how the market itself has performed in the six years since Brexit and where it is headed?
Transactions
In the 71 months between July 2016 and May 2022, there were 7.24 million residential transactions in the UK, HMRC data shows. That was a rise of 14.4% on the equivalent period before the referendum (6.32 million). If this was the housing market’s biggest test after Brexit, it passed.
It hasn’t exactly been a linear trend, though.
Transaction numbers in Q2 2016 were low due to the introduction of an additional 3% stamp duty rate for second homes in April 2016 but climbed throughout the year, seemingly unaffected by the Brexit vote (see chart below).
Activity was then restrained after the 2017 general election, which left the government with no working majority. After very early signs of a surge in Q1 2020 following the decisive general election result of December 2019, Covid struck. A rapid decline was followed by unprecedented levels of activity that were buoyed by a stamp duty holiday.
Conclusion: The referendum itself had little impact on UK transaction volumes. The effect was more delayed and indirect, with an unstable government keeping a lid on activity for several years from the summer of 2017. Then Covid came along and made longer-term conclusions impossible. The next stage for the housing market is normalisation, a process that is proving more gradual than most people expected.
Prices
It is a similar pattern for prices in recent years, as the chart below shows.
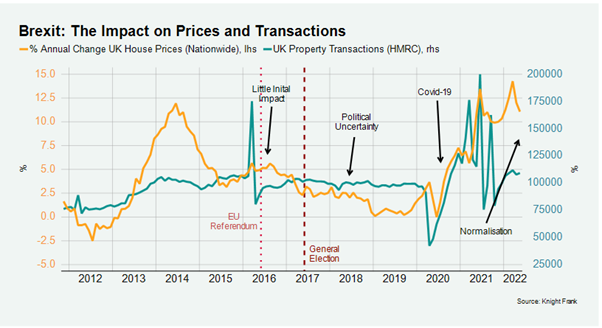
In the period between July 2016 and May 2022, UK prices grew by 32%, Nationwide data shows. In the same period before the referendum, growth was 22.5%. So, Brexit appears to have passed this particular test, too.
There was a period of stagnation between 2017 to 2019 as Theresa May’s government remained in a precarious position but the pandemic brought a period of double-digit price growth thanks to low supply and high demand.
Conclusion: Political turmoil at Westminster rather than Brexit itself kept price growth in check after 2016. Prices jumped due to the pandemic but may have done so anyway had the ‘Boris Bounce’ not been cut short by Covid. Price growth has begun to cool as supply rebuilds and higher mortgage rates moderate demand.
Levelling Up
There has been some regional divergence in house prices over the last six years, as the table below shows. However, the outperformance of the East of England and the North West is the result of affordability pressures rather than anything Brexit-related.
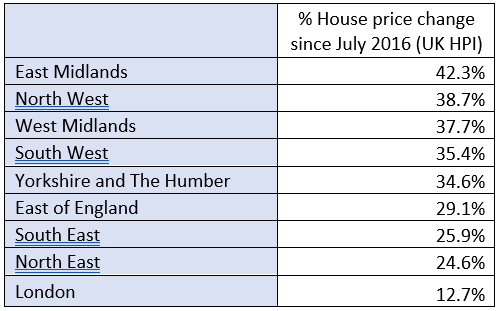
The general rule remains that more affordable parts of the UK have seen stronger price growth, a trend we expect to continue. Meanwhile, prices in prime central London have fallen 14% since July 2016, largely due to the emergence of a more adverse tax landscape but compounded by the political volatility that followed the general election result of June 2017.
Conclusion: House prices across the UK have made up ground with London over the last six years but for reasons largely unrelated to Brexit. This process of ‘levelling up’ should continue over the next several years. Prime central London remains in steady recovery mode, which will be accelerated by the return of meaningful numbers of international buyers.
Mortgage Rates
The cost of a five-year fixed rate mortgage in May (2.63% for 75% LTV) was almost identical to six years ago (2.64%). The downwards trajectory that began after the global financial crisis bottomed out in September 2021 in the mortgage market – the best month in recent decades to fix for five years. While rates were on their way down in May 2016, they are now on their way up.
Conclusion: Uncertainties around Brexit have made the Bank of England more dove-ish in recent years and contributed to keeping rates lower for longer. Brexit remains politically divisive but its impact on monetary policy is currently marginal compared to the cost-of-living surge, which is a global issue.
Currency
The impact of the EU referendum on Sterling has been clear-cut - it had fallen 16% versus the US dollar by the end of 2016. The pound rose and fell over the next several years as the prospects of an orderly exit ebbed and flowed but there has been downwards pressure in recent months as the Bank of England has held off raising rates.
It has driven demand among overseas buyers even while numbers have been kept in check by international travel restrictions for the last two years. A US buyer in prime central London would benefit today from an effective discount of 27% compared to before the referendum, taking currency and price movements into account.
Conclusion: Arguments will continue over whether the pound is realistically priced to account for the trade deal agreed between the UK and EU on Christmas Eve 2020 and Covid has only muddied that particular debate. For now, overseas buyers are still benefitting from a discount that may shrink if the Bank of England becomes more hawkish in tackling inflation.