Pandemic redraws UK house price map
The combination of the race for space, a stamp duty holiday and an ongoing affordability squeeze has altered the landscape for UK house prices.
3 minutes to read
Simple arithmetic tells us the stamp duty holiday benefitted some property markets more than others.
The measure, which ran from July 2020 to September 2021, was designed to help the UK economy cope with the pandemic. In England, the tax-free threshold was temporarily raised to £500,000 from £125,000. An equivalent Welsh threshold was raised to £250,000 before reverting to £180,000 last June.
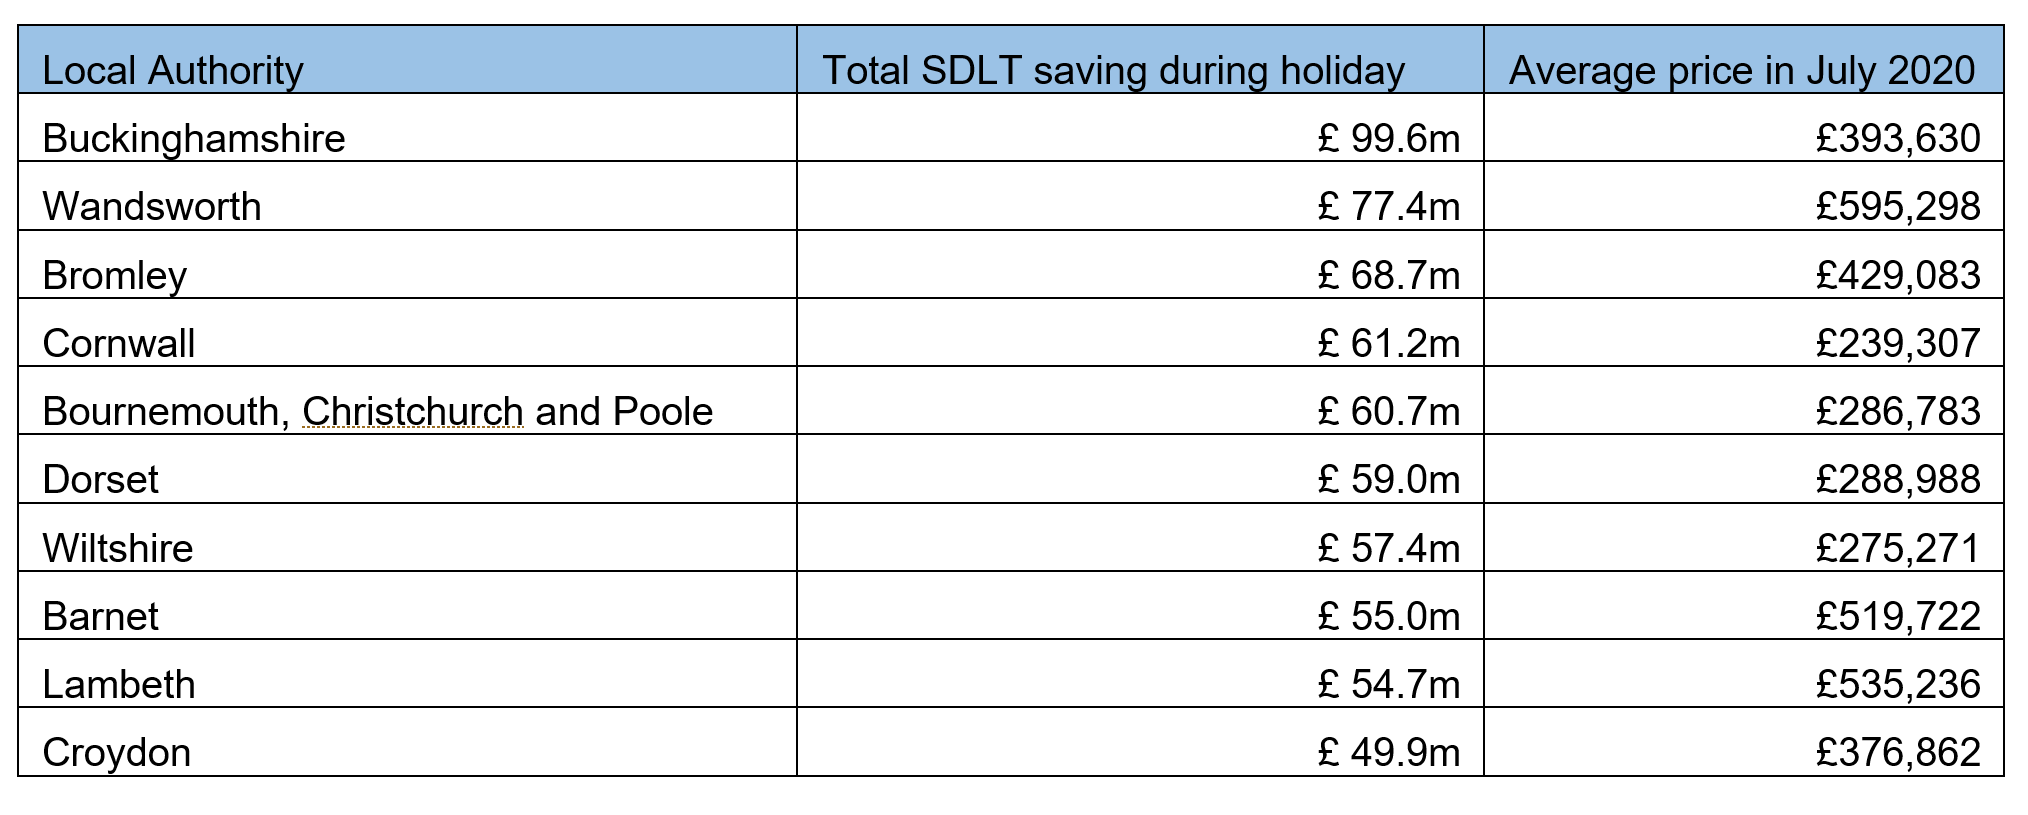
The saving in England was therefore greatest in locations where the average property price was close to £500,000.
Buckinghamshire and Wandsworth were the two local authorities in England and Wales where buyers benefited most during the 15-month holiday. In Buckinghamshire (where the average price was £393,630 in July 2020), buyers saved a combined £99.6 million, an analysis of Land Registry transactions shows. In Wandsworth (average price £595,298), the saving was £77.4 million.
It is no surprise that Cornwall, Bournemouth and Dorset also feature in the top ten given the ‘race for space’ sparked by successive lockdowns.
The list of local authorities that benefitted least from the holiday was dominated by Welsh areas given the comparatively smaller size of the tax break. However, Burnley (£1.2 million) and Blackpool (£1.3 million) in England were also areas that benefitted less given that average house prices in both local authorities were under £110,000 last July.
However, this is a fairly straightforward way of assessing the impact of the stamp duty holiday.
House price growth in London was under-performing the rest of the country before the pandemic as the affordability squeeze meant a growing number of people were leaving the capital. If we look at the impact of the stamp duty holiday on prices, it clearly accelerated this process of levelling-up between London and the rest of the country.
“The combination of the race for space and a stamp duty holiday has helped property prices converge and housing equity become more evenly distributed around the UK,” said Tom Bill, head of UK residential research at Knight Frank. “During the pandemic, this has benefitted picture-postcard locations as buyers have sought more space and greenery. As the pandemic comes to an end, a wider levelling-up process will continue due to affordability constraints in markets like London.”
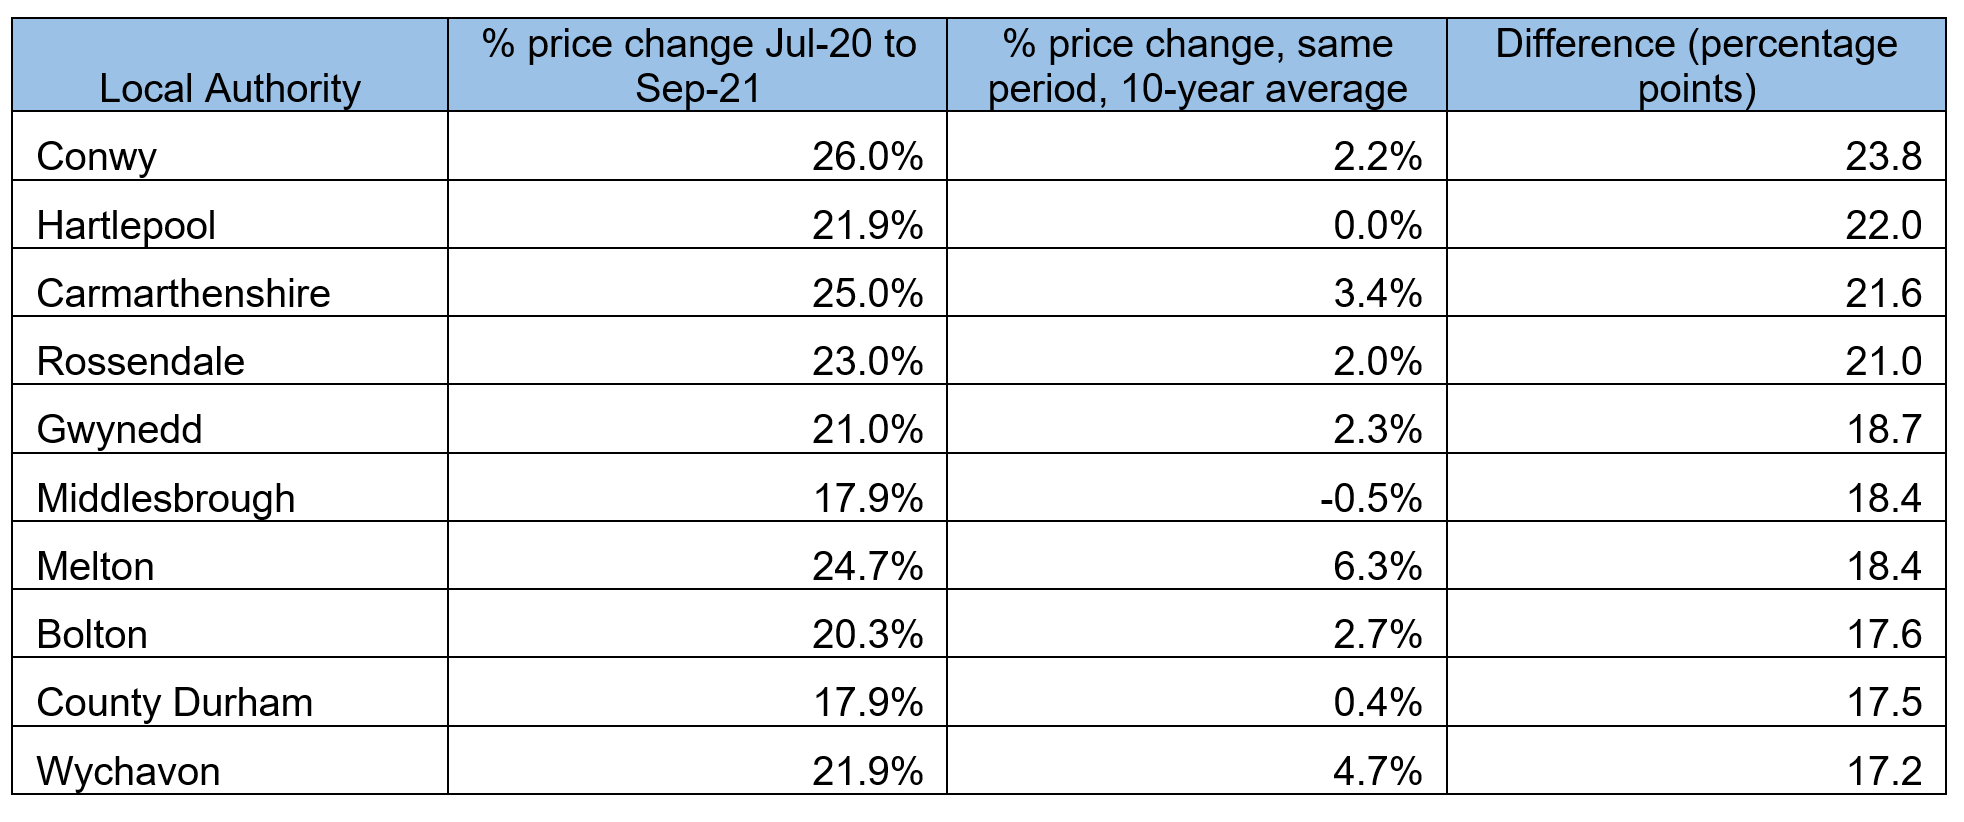
The areas that saw the largest price growth during the stamp duty holiday versus the ten-year average are listed below, demonstrating how the tax-break also benefitted locations like Hartlepool, Middlesbrough and Bolton. The bottom ten include London boroughs that saw rapid gentrification and strong house price growth before the pandemic, including Hackney, Newham, Lewisham and Lambeth.
In fact, the common assumption that prices in north-east England are still below their pre-global financial crisis (GFC) peak is no longer true. The average price (£143,826) is now above its previous peak in December 2007, having passed this milestone in January 2021. By way of comparison, London reached its pre-GFC peak in April 2012.
In further proof that the gap with the capital is closing, the average property price in each UK region in September 2021 was the highest it has been compared to the London average in at least six years.
You can expect a lot to be written about the pandemic’s legacy this year. One consequence is that the combination of the affordability squeeze, the race for space and the stamp duty holiday has levelled up UK house prices, a process that still has some way left to run.
Photo by William Hook on Unsplash