Care home sector showing signs of pandemic recovery
Demand for beds remain strong as the resilient sector begins to show signs of a bounce back.
3 minutes to read
The 2020/21 financial year is likely to have absorbed the majority of the shock created by the emergence of Covid-19 and has certainly presented the sector with a mountain of challenges. As a result, despite maintaining its usual structure and metrics reported, this year’s report also raises the question of the sector's resilience and ability to adapt following external shocks.
Key report findings:
-
Across England Covid-19 deaths accounted for 24% of all care home deaths, with the lowest and highest percentages relative to all deaths in the South West at 19% and the North East at 29% respectively.
-
Average occupancy is down year on year from 87.9% to 79.4%, an expected result of the pandemic amplifying the usual issue of care home mortality rates. London saw the biggest occupancy decline, suffering a 15% fall, whilst Scottish occupancies proved to be the most resilient with a 5.9% reduction on the year.
-
Average weekly fees saw an overall increase of 6.7% on the year. Within this Local Authority fees grew by 8.8%, this is a likely combination of general annual fee growth and the government intervention seen in response to the pandemic.
-
Average nurse wages per hour are up 2.9% from last year whilst average career wages per hour grew 5.4% on the year. Both have grown at a higher rate on the year than the 2.2% growth in the National Living Wage per hour.
-
Agency use as a percentage of staff cost has fallen to 6.8%. This is likely to be an artificial impact of the pandemic via the reduction in occupancy levels, as well as the logistics around both permanent and temporary staff entering care homes during lockdown periods.
-
Overall, EBITDARM as a percentage of income fell slightly from last year’s level of 26.8% to 26.2%, a figure which although a declining one, highlights the resilience of the sector and the operators.
The sample
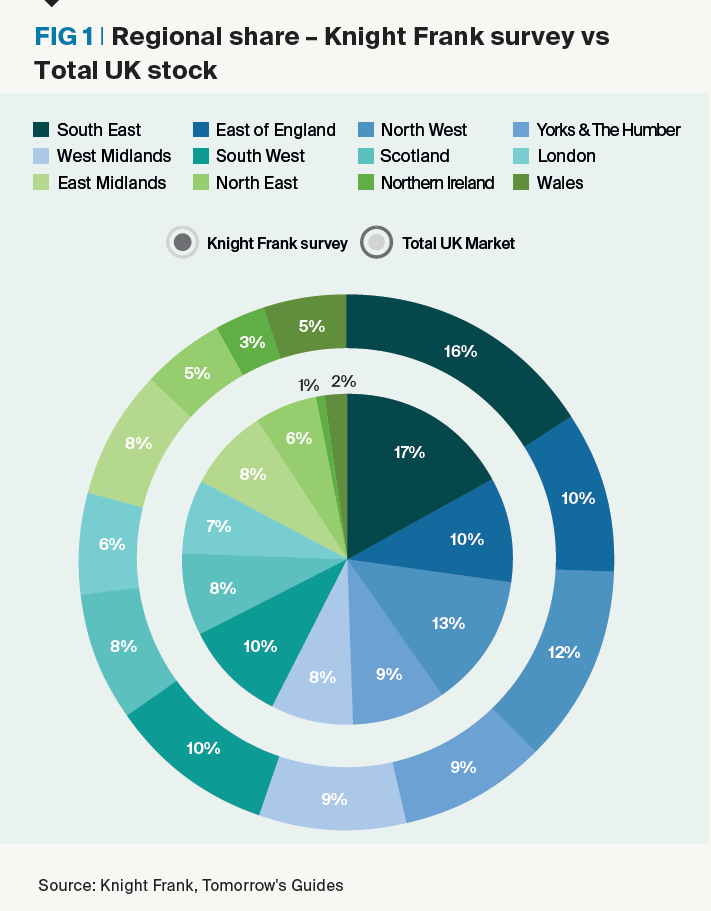
This year the sample represents just over one fifth of the care market. Whilst this is a significant portion of the sector, consistency and accuracy are key factors to consider whilst assessing the sample. Figure 1 shows the regional composition of the sample in comparison to the total UK market. The chart suggests that the sample is quite closely correlated with the exception of Northern Ireland and Wales, where the sample is slightly underweight.
Consistency check
In addition to verifying the regional split we have also addressed the issue of consistency. Each year there may be some variation in the participants by way of operators who are unable to contribute, as well as those who are contributing for the first time.
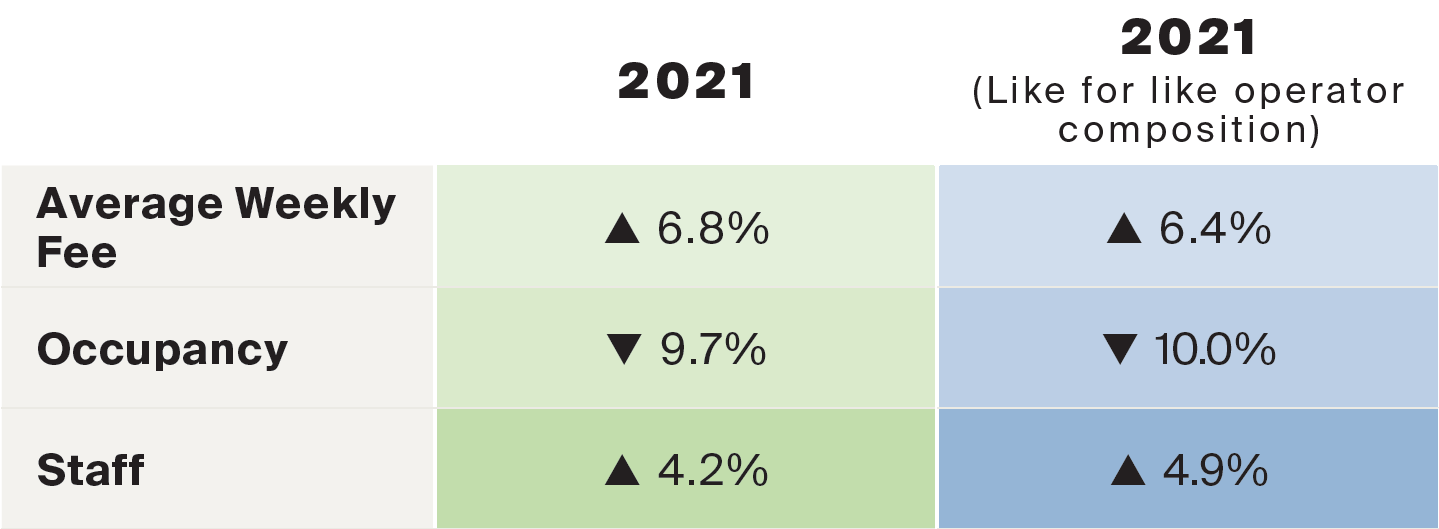
Table 1 (below) shows our consistency check of this year’s key metrics based on a like-for-like sample, effectively checking whether year-on-year changes are consistent or distorted by changing operator composition. Again, as metrics such as fees, occupancy and staff costs are consistent with the like-for-like sample, we can be comfortable in the accuracy of the trends presented.
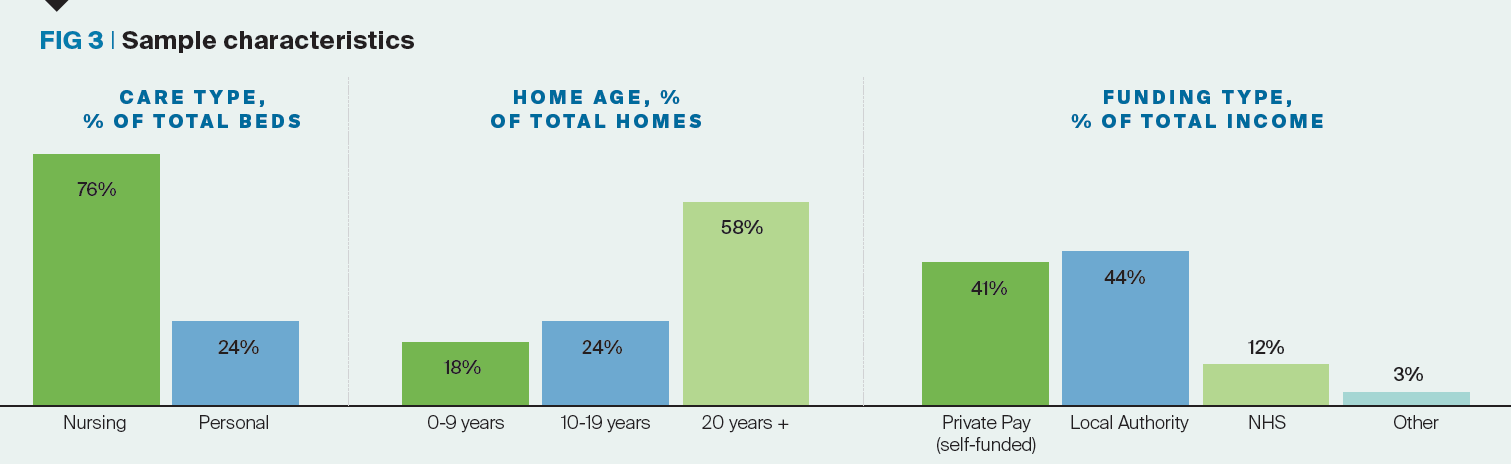
Sample characteristics
Figure 3 shows further composition analysis, with Nursing accounting for a majority of the care type, funding split fairly even amongst Private Pay and Local Authority and homes over 20 years old contributing to more than half of the index.
Read the latest UK Care Homes Trading Performance Review to discover more about the sectors resilience and ability to adapt following external shocks.