Where are the world’s innovation-led cities?
Knight Frank’s research into innovation-led cities has collected over 100 different indicators, including data on almost 100,000 research institutions globally. From a long-list of 750 cities, these indicators have been applied to 288 cities worldwide to determine which lead innovation and growth, and therefore offer the greatest prospects for resilience for commercial real estate investors.
4 minutes to read
In the scatter plot below, we compare city innovation scores with real estate liquidity rates. Lower risk investors are likely to favour cities with above average innovation scores and higher liquidity scores, which lie to the right. The cities scoring higher for innovation, but which are less liquid, seen towards the left of the chart, attract those willing to take more risk, such as private equity investors, for example.
The innovation score comprises four components: i) quality of innovation factors, ii) innovation infrastructure, such as the number of different research organisations in a city, iii) funding and iv) drive to innovate, which looks at data around motivation to innovate. The score is between 0 and 10, with 10 being highest.
The liquidity score for a city is based on factors including the number of commercial real estate assets, the average annual transaction volume and the ease of doing business. The same 0-10 rating is used.
Innovation-led cities
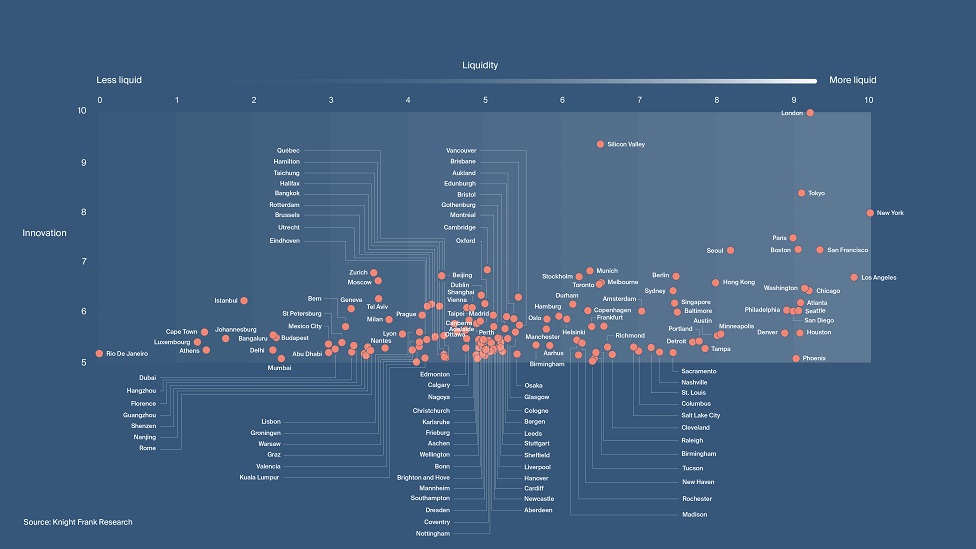
Click to enlarge
London, New York and Tokyo lead the way
The cities in the top right quadrant have a combination of above-average innovation and above average liquidity. They include London, UK, as the stand-out performer for innovation as well as New York, US and Tokyo, Japan. While these cities may undergo short-term shocks, they have the greatest potential to remain economically resilient in the longer term.
For example, according to the Times Higher Education, London has three universities in the top 100 ranked globally against the United Nation’s Sustainable Development Goal 9: Industry, Innovation and Infrastructure.
These universities drive research that advances industry innovation and infrastructure, generates patents and creates spin-offs. They also undertake industry-backed research.
Meanwhile, according to the Centre for Entrepreneurs, more than 221,000 new business were formed in London during 2019, approximately one-third of the UK total. Of these, 17,400 were tech businesses, providing a rich pool for potential links to London’s world-leading universities.
However, smaller cities in the UK also score highly for innovation. Oxford and Cambridge sit at each end of the Brain Belt, benefiting from up to £5.5 billion of infrastructure investment. They also form the top side of the ‘Golden Triangle’, which is the unofficial term for research universities between these innovation hotspots and London.
These cities illustrate how a strong research-led university sector can help build market resilience. During the Global Financial Crisis, Cambridge saw stable-to-increasing rents and compressing prime yields, while Oxford had only one year of negative rental growth and saw yields rise by only 25 bps.
Asia-Pacific is represented in the top 20 most innovative cities by Tokyo, Melbourne, Canberra and Sydney. One example of the impact innovation has on commercial real estate is Sydney’s Ultimo district. This is where the University of Technology’s faculties of Science, Health, Arts and Social Sciences, Engineering and IT, and Design, Architecture and Building are based. In the last three years, Ultimo has seen office rental growth of over 50%.
New York is the top city in the US for innovation and ranks at number two globally, while Toronto takes the top spot in Canada and ranks 8th globally. In mainland Europe, the 25 most innovative cities include Paris, Berlin, Munich, Zurich, Geneva and Stockholm. Berlin and Stockholm have seen strong rises in transaction volumes over recent years.
Methodology
Starting with a long-list of 750 global cities, we excluded those that had seen fewer than 10 deals or $75 million of transactions over the previous 12 months. Cities with fewer than 150,000 households, a population of less than 250,000, and employment of 200,000 or lower forecast in five years, were also removed. That left 288 cities, for which we collected over 100 variables relating to innovation.
As innovation is somewhat intangible and difficult to measure directly, we used statistical modelling techniques to find which observable variables best represented innovation and so created an innovation score for each city.
This comprised four components:
- Quality of innovation; including the quality of academic research, the international repute of universities and the quality of life in the city to attract talent.
- Innovation infrastructure; the quantum of different research organisations and groups.
- Funding; biomedical research funding.
- Motivation to innovate; grassroots motivation to innovate.
Sources include Oxford Economics, Numbeo, Meet-up, Grid.ac, World RePORT, startupblink, Real Capital Analytics and The World Bank.