Where will capital flow in 2021?
Using a bespoke ‘capital gravity’ model, we have been able to forecast the likely flows of capital between countries, as well as their estimated sizes for 2021.
3 minutes to read
Due to the dramatic impacts Covid-19 has had on real estate investment and global mobility, we predict that cross-border flows to safe-haven locations and flows between ‘near-neighbours’ are set to dominate, led by investment from Canada to the US and from the US to the UK.
We have also examined real estate transactions from 2016, many of which would have been financed over five years, and so have predicted the types of assets coming to market over the next year. We also note that, in a climate of flatter returns on investment, changes in currency and hedging benefits may divert investment flows to cross-border markets that offer such extra gains from real estate transactions.
Forecasting capital flows in 2021
Our capital gravity map predicts the major flows of foreign capital for 2021. The map shows that over the coming year, the focus of capital flows will principally be between liquid, global safe-havens, as investors continue to seek out true diversification. Nevertheless, core, income-producing assets in ‘near-neighbour’ locations will also attract demand at a time when some physical travel remains subject to restrictions.
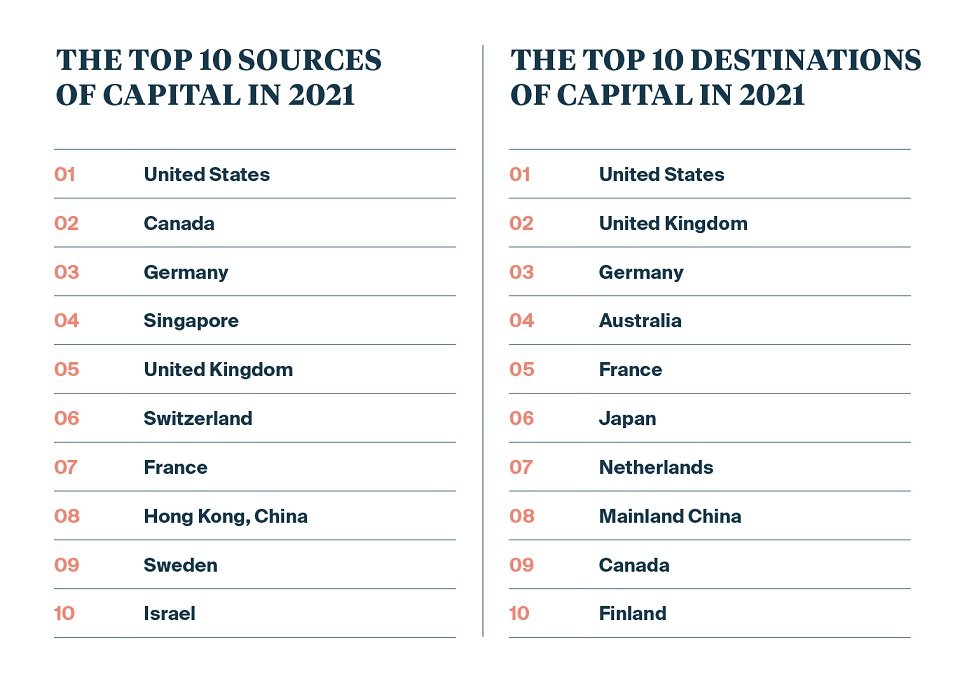
With the potential for more distress to be seen in 2021, investors from private equity funds, private capital and debt funds could also consider cross-border transactions further afield. The United States, Germany, United Kingdom and Singapore are likely to be major players in cross-border activity. But if oil prices remain depressed, we expect that the deployment of capital from oil-dependent countries will accelerate too.
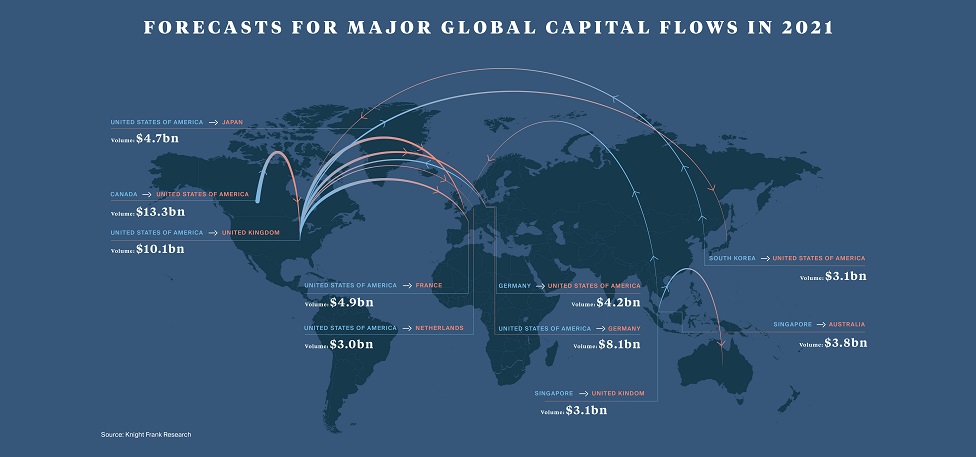
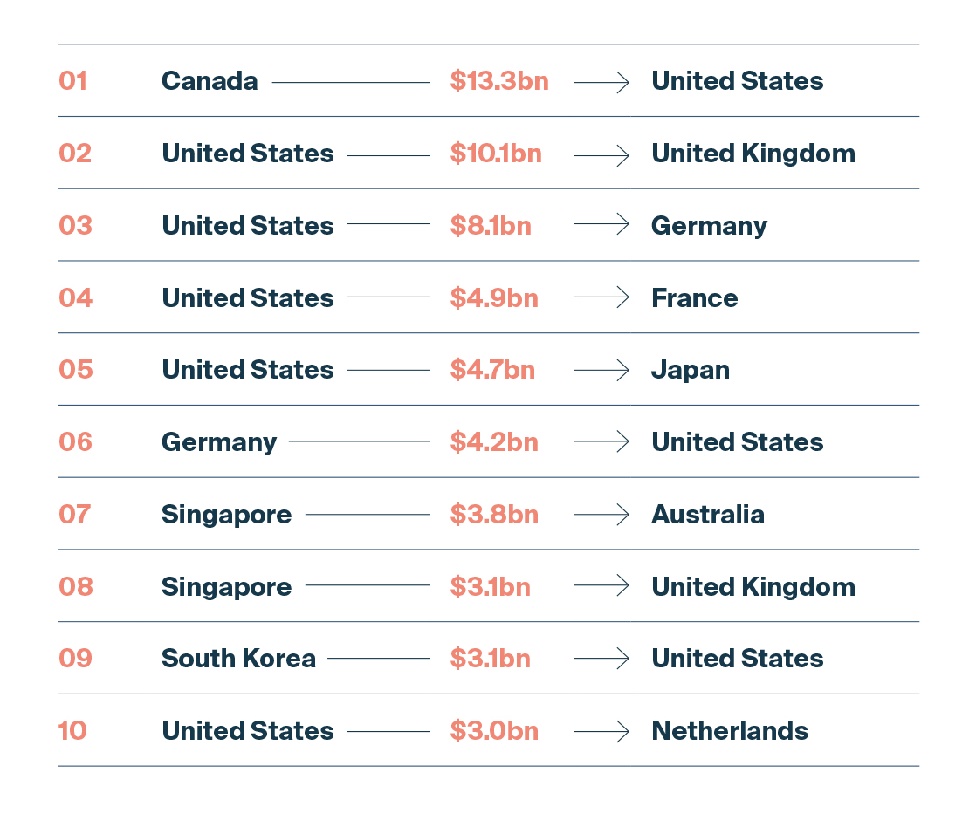
The predicted top 10 flows for cross-border capital in 2021
Understanding our ‘capital gravity’ model
By continuously enhancing our capital gravity model, first used in 2018, to analyse cross-border real estate investment inflows, we can predict the leading flows for cross-border capital and their estimated size. Gravity models are common in international trade, yet there has been little application of them to real estate investment.
Using the Poisson pseudo-maximum-likelihood, a recommended method for estimating real estate capital flows1, we estimate the key flows for the coming year. We focused on identifying the main factors behind the largest variation in direct real estate investment flows. These are GDP, foreign direct investment as a percentage of GDP, exchange rate, world share price index, the distance between two countries, common languages, common borders and historic ties. We also included a ‘shock’ variable, as the period being forecast follows a significant disruption.
1 McAllister and Nanda (2016)
Which assets will come to market in 2021?
In many destinations, the lack of stock available for sale has limited transactional volumes. While governments and central banks support economies – although many are now in recession – we have yet to see much fallout in real estate. However, as fiscal and monetary support unwinds, we can expect more distressed assets coming to the market next year.
Another potential source of supply comes from the rotation of real estate assets. Assuming a typical five-year hold or financing period, by looking at 2016 transactional activity, we can predict the types of assets for the coming year. For example, in the US, 2016 saw $145 billion of office transactions, spanning the country, including the strong innovation-led cities (ILC) of New York, Palo Alto, San Francisco and Atlanta. Additionally, $61 billion of industrial assets were purchased throughout the country.
In short, we should expect to see a range of assets – from traditional office and through to the industrial, residential and alternatives sectors coming to the market for rotational reasons in 2021, even if some investors extend their business plans. These should offer a mix of cyclical and core opportunities.
It is also useful for investors to monitor private equity activity, which is often the first mover into a market and therefore a leading indicator. Japan, for example, has seen a significant increase in cross-border transactional activity during Q2 2020 by private equity investors, ($3.4 billion in Q2 2020, vs $975million in Q1 and $161million Q2 2019) notably a portfolio of apartments purchased by Blackstone from Anbang Insurance. Private equity activity has risen across sectors in the UK, and a large rise in Switzerland is centred around the purchase of a retail portfolio, with units in some innovation-led cities.