Insight 2: What Drives Leasing Out-Performance?
The London market has become increasingly polarised. The prime market is seeing heightened levels of demand, a deepening imbalance between supply and demand and, as a consequence, further upwards pressure on rents.
10 minutes to read
Polarising Times
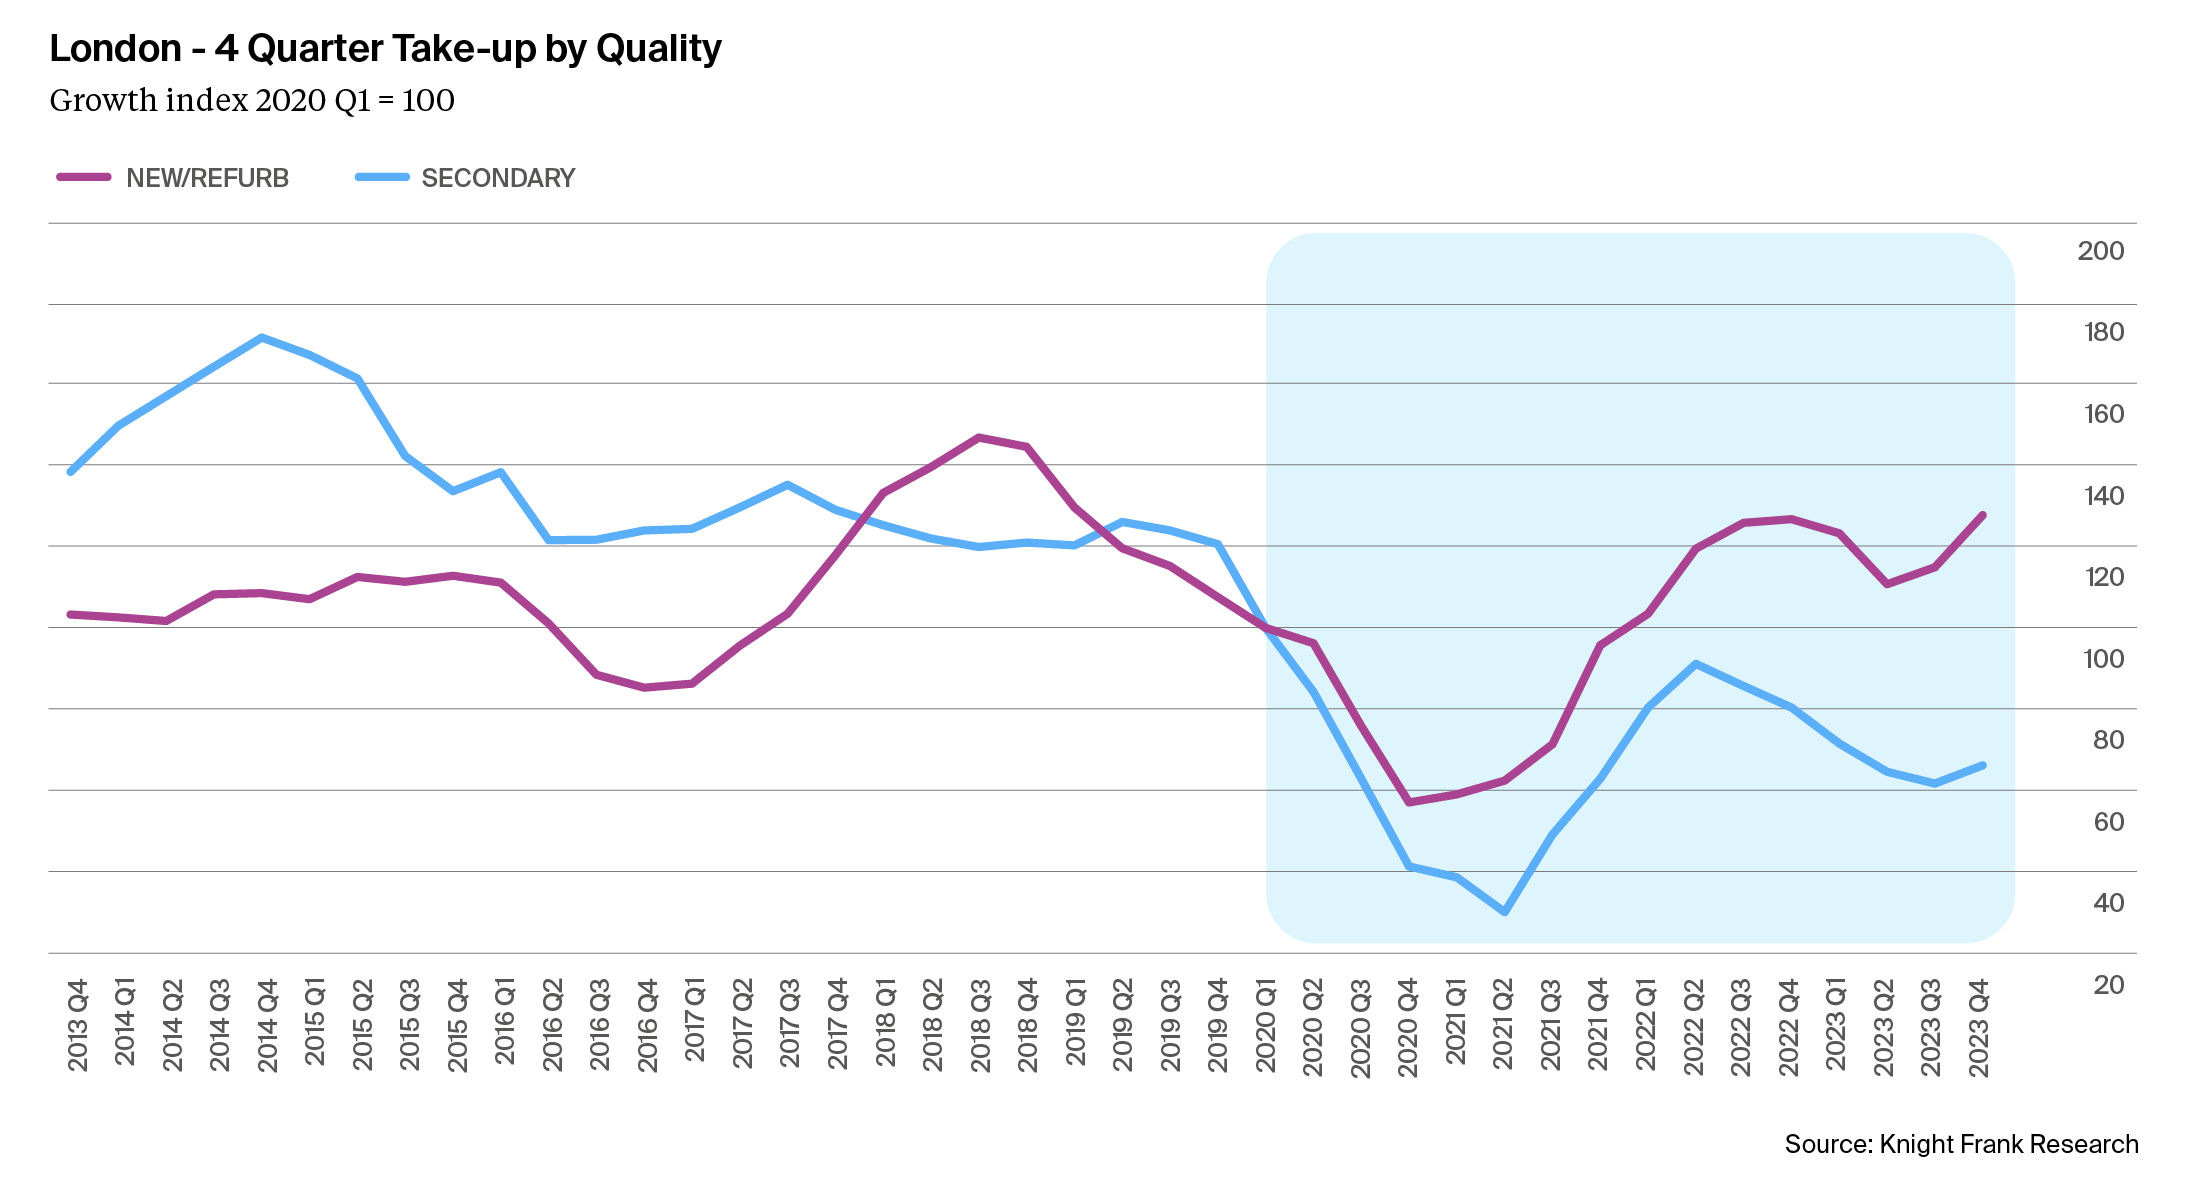
The pandemic experience has acted as a fork in the road as occupier demand has increasingly favoured new and refurbished offices.
Lettings in this part of the market have increased 28% since 2020. In contrast, lettings of secondary offices have fallen by 44% over the same period. We have examined post-pandemic leasing transactions and identified two key factors that have driven the out-performance of new and refurbished offices:
1. Sustainability – The take-up of offices with a BREEAM certification and an Energy Performance Certificate (EPC) rating of A-C are both at the highest levels for over five years in London. Last year, offices with a BREEAM certification accounted for 65% of all office lettings, whilst 75% of all new and refurbished lettings were BREEAM certified. Moreover, 62% of new and refurbished lettings were for offices with the highest certifications of ‘Outstanding’ and ‘Excellent’.
"Our recent (Y)OUR SPACE report showed occupiers have Sharpened their focus on office space which meets their sustainability ambitions and provides a high-level of amenity to support increased office utilisation rates and enhance employee wellbeing."
Interestingly, our frequent interaction with global occupiers suggests the importance of sustainability credentials for offices varies by occupier group.
2. Amenity Provision – In our 2023 London Report we showed how many of London’s Core and new business districts had a high level of amenity within a master plan across campus, traditionally a key consideration of occupiers.
Our analysis of post-pandemic lettings shows almost all new and refurbished buildings have end-of-trip facilities such as cycle racks, showers and lockers, but the essential differentiator of best-in-class offices is in the quality of the in-building amenity offer. These include terrace floors, green spaces, wellness facilities, food and beverage offerings, retail, hospitality and serviced office uses.
Furthermore, lettings of offices with these quality characteristics have seen stronger rental growth compared with offices without these facilities. We analyse this further in our upcoming supplementary paper which takes a closer look at the effects of quality bifurcation on rents across London’s submarkets.
We expect the quality bifurcation of the office market to intensify in 2024. Our recent (Y)OUR SPACE report showed occupiers have sharpened their focus on office space which meets their sustainability ambitions and provides a high level of amenity to support increased office utilisation rates and enhance employee wellbeing. All under the direction of the CEO to help drive productivity in the post-Covid cycle.
"Those larger occupiers with publicly stated net-zero carbon emission targets, often consider sustainability as a key requirement of their future workplace."
Positive Net-Absorption
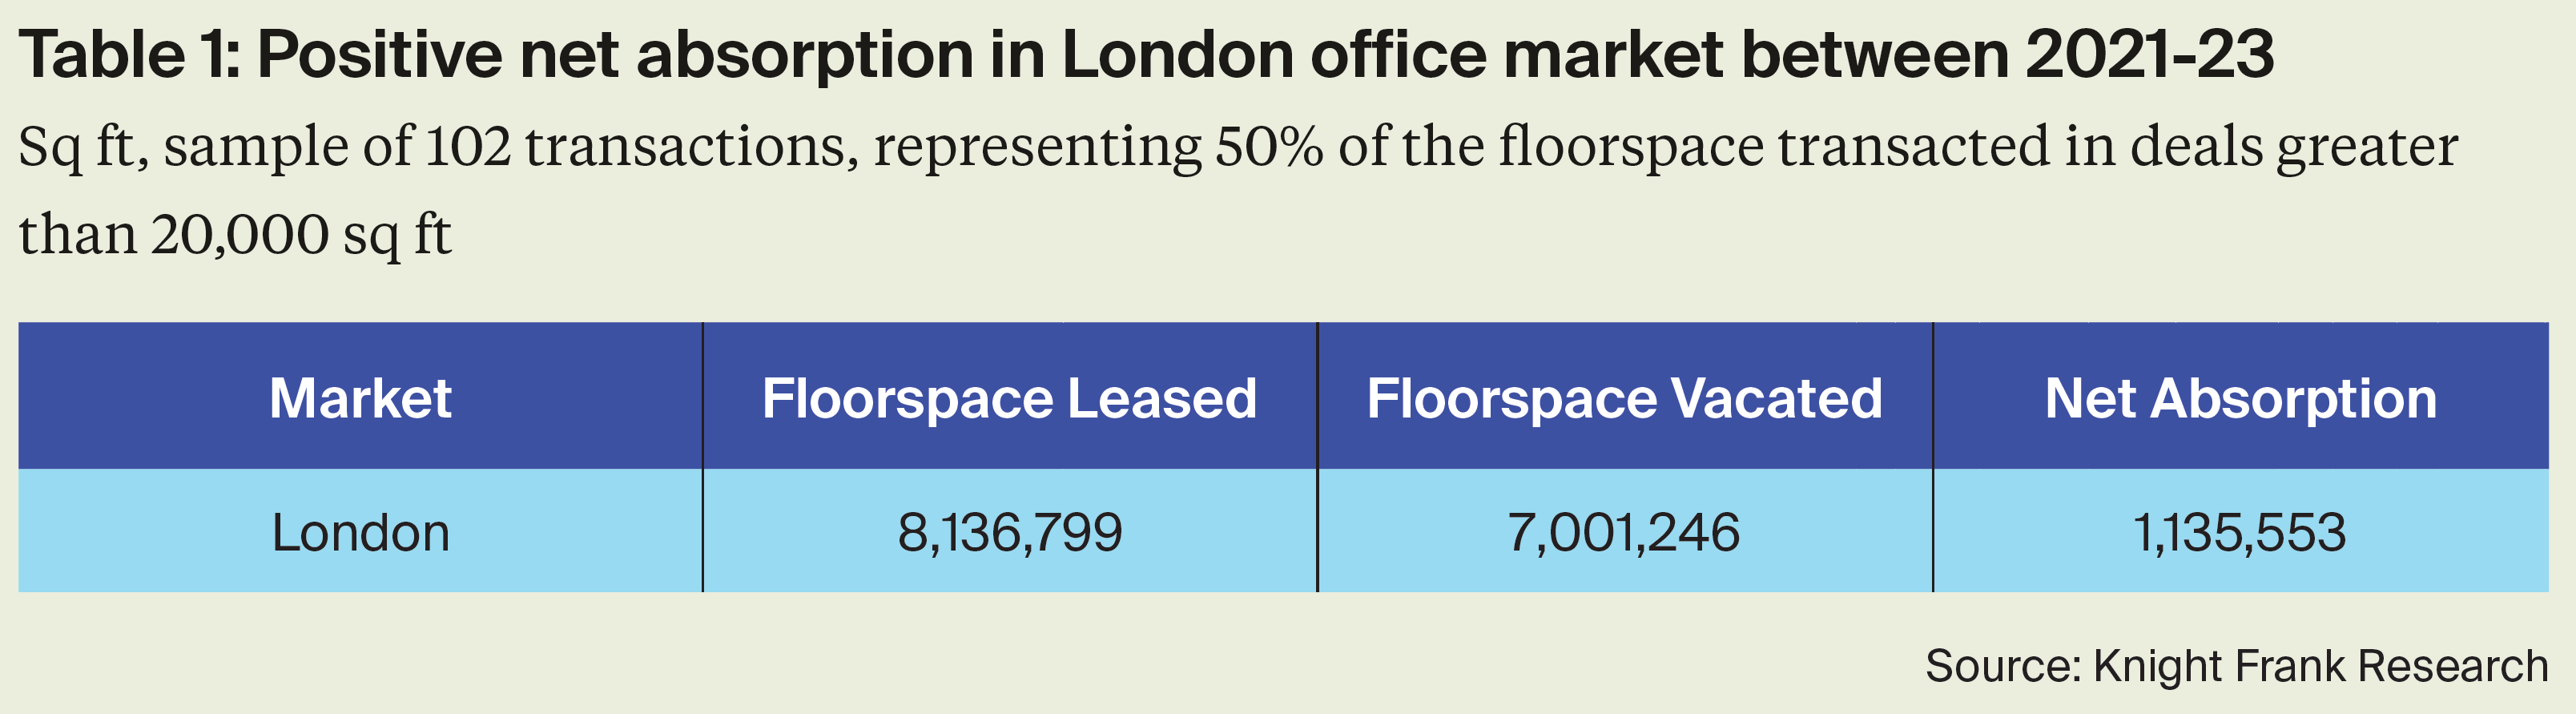
Historically, a growing economy plays a key role in driving the performance of London offices, however, since the pandemic there has been a decoupling of demand from wider economic trends, with occupiers using real estate as a strategic device to drive performance. We have analysed absorption in the London office market since 2021, by looking at a sample of transactions greater than 20,000 sq ft.
Our sample covers just over 100 deals and 50% of the floorspace transacted. Most importantly we biased our sample with occupiers moving between London submarkets and have a small number of new market entrants. This means our estimation of net absorption is likely to be conservative. Our sample shows 8.1m sq ft of positive absorption of office space whilst just over 7m sq ft has been vacated by occupiers. This implies the occupiers in our sample accounted for 1.1m sq ft of net absorption. Over two-thirds of occupiers have relocated to more space than vacated.
This was evident in both the key business districts in the City and West End. Our analysis shows that, contrary to the widely held view that occupiers have been reducing their office footprints since the pandemic, many occupiers have, in fact, been relocating to more office space – implying positive net absorption. Positive net absorption is a key ingredient for rental growth, and this has been evident for prime offices in many London submarkets.
"Our sample shows 8.1m sq ft of positive absorption of office space whilst just over 7m sq ft has been vacated by occupiers. This implies the occupiers in our sample accounted for 1.1m sq ft of net absorption."
Can We Expect Positive Net Absorption to Continue?
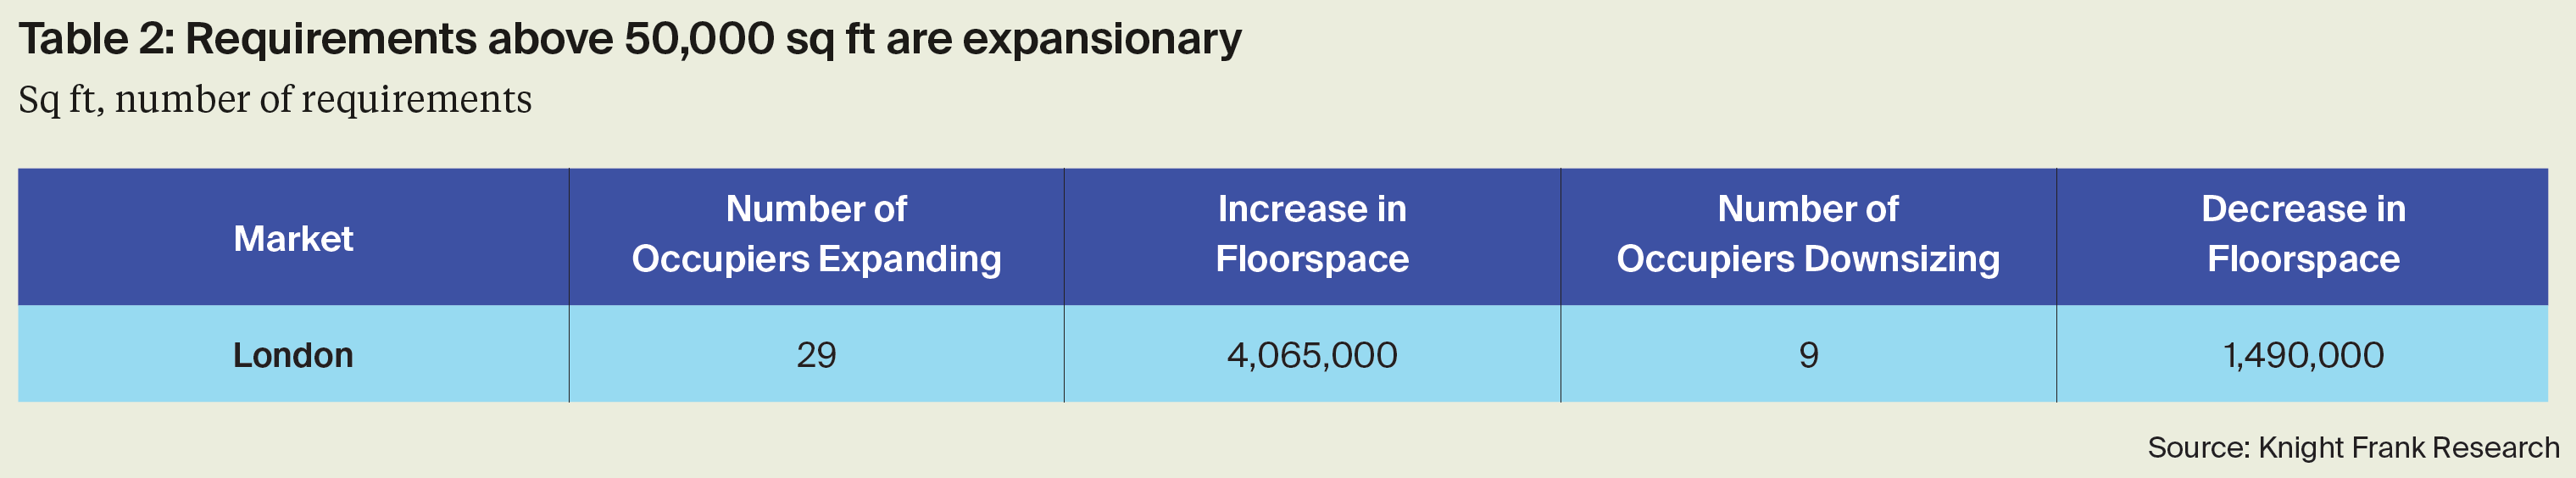
In addition to recent deals, we have analysed current named requirements over 50,000 sq ft. These requirements equate to 11.9m sq ft – a 10-year high.
There are 51 requirements – totalling 7.3m sq ft – for offices above 50,000 sq ft. Of these, 29 requirements are expansionary, and nine are contractionary. The remaining 13 requirements are either new entrants or smaller and high growth companies where previous occupancy details have not been disclosed. The expansionary requirements could lead to a net additional floorspace of 4.1m sq ft, whilst the contractionary requirements could bring a net floor space reduction of 1.5m sq ft. This analysis suggests a potential net absorption of 2.6m sq ft over the next 12-18 months.
Accommodating Future Demand With New Supply
Unlike previous London office market cycles, the under-construction development pipeline falls short of even meeting average levels of take-up of new and refurbished offices and, in fact, falls considerably below current levels of new and refurbished take-up.
Under-construction speculative developments fell by 11% during the fourth quarter of 2023 to 11m sq ft and we expect this pipeline to by delivered between 2024-26. In addition, consented schemes, where we place a high probability of completing (50-75%) could add a further 1.9m sq ft to the under-construction pipeline, extending the delivery timeline to 2028. We expect this figure to be under pressure from lower levels of development finance as funding will likely be provided to schemes that have been considerably de-risked.
"Under-construction speculative developments fell by 11% during the fourth quarter of 2023 to 11m sq ft and we expect this pipeline to by delivered between 2024-26."
The Demand and Supply Mismatch
We believe the under-construction pipeline, which completes by 2026, is 5.3m sq ft below average levels of take-up of new and refurbished space. This implied under-supply is greatest in the City Core (3.1m sq ft), King’s Cross/Euston (869,000 sq ft) and Clerkenwell/Farringdon (768,000 sq ft).
A simple comparison of recent new and refurbished take-up, and the under-construction pipeline by size band, highlights that future supply falls short of recent demand across most size bands. In the City, future supply is below recent take-up levels in all size bands above 40,000 sq ft whilst in the West End, the 40-60,000 sq ft and 80-100,000 sq ft size bands show the greatest mismatch between recent demand and future supply.
The Race to Pre-Let Space
Leasing trends for development schemes have seen significant change in recent years. Since 2016, a high proportion of schemes have achieved ‘fully let’ status ahead of practical completion (PC). Our analysis of development projects shows, on average, occupiers preleasing space up to 13 months ahead of PC. This increases to 29 months for schemes larger than the largest schemes currently under construction, and due to complete by 2026, shows just over 54% is already pre-let.
We expect the pre-let market will strengthen in 2024. Between 2024-26, there are 28.3m sq ft of lease expiries across London. This is more than 2.5 times the level of expected speculative development completions. The bulk of lease expiries this decade occur between 2027-30, some 37m sq ft, and with little visibility of development schemes completing beyond 2026, this will further incentivise occupiers to bring forward decisions regarding their future occupation.
Furthermore, this level of structural demand relative to low levels of future supply will lead to continued rental tension for new and refurbished offices. This is further reinforced by our expectation of new and refurbished vacancy rates in London’s main business districts falling significantly below long-term average levels. Currently, in the City Core, the new and refurbished vacancy rate is 4.8% compared with a long-term average of 4.9% and in the West End Core it is 2.8% and below the long-term average of 2.9%.
These anticipated trends are expected to strengthen pre-letting activity, and with demand outstripping supply, there will be pressure for rents to rise. This will be a welcome outcome to many developers currently hampered by high constructions costs affecting the viability of development projects.
Against this back-drop, there has been an increasing trend of regears over the last three years, given occupiers have been unable to find what they are looking for or unable to justify the capital expenditure required to relocate. We anticipate this will continue. However, the majority of regears are between three and five years, and serve to place pressure on the longer-term development pipeline.
The Outlook for 2024
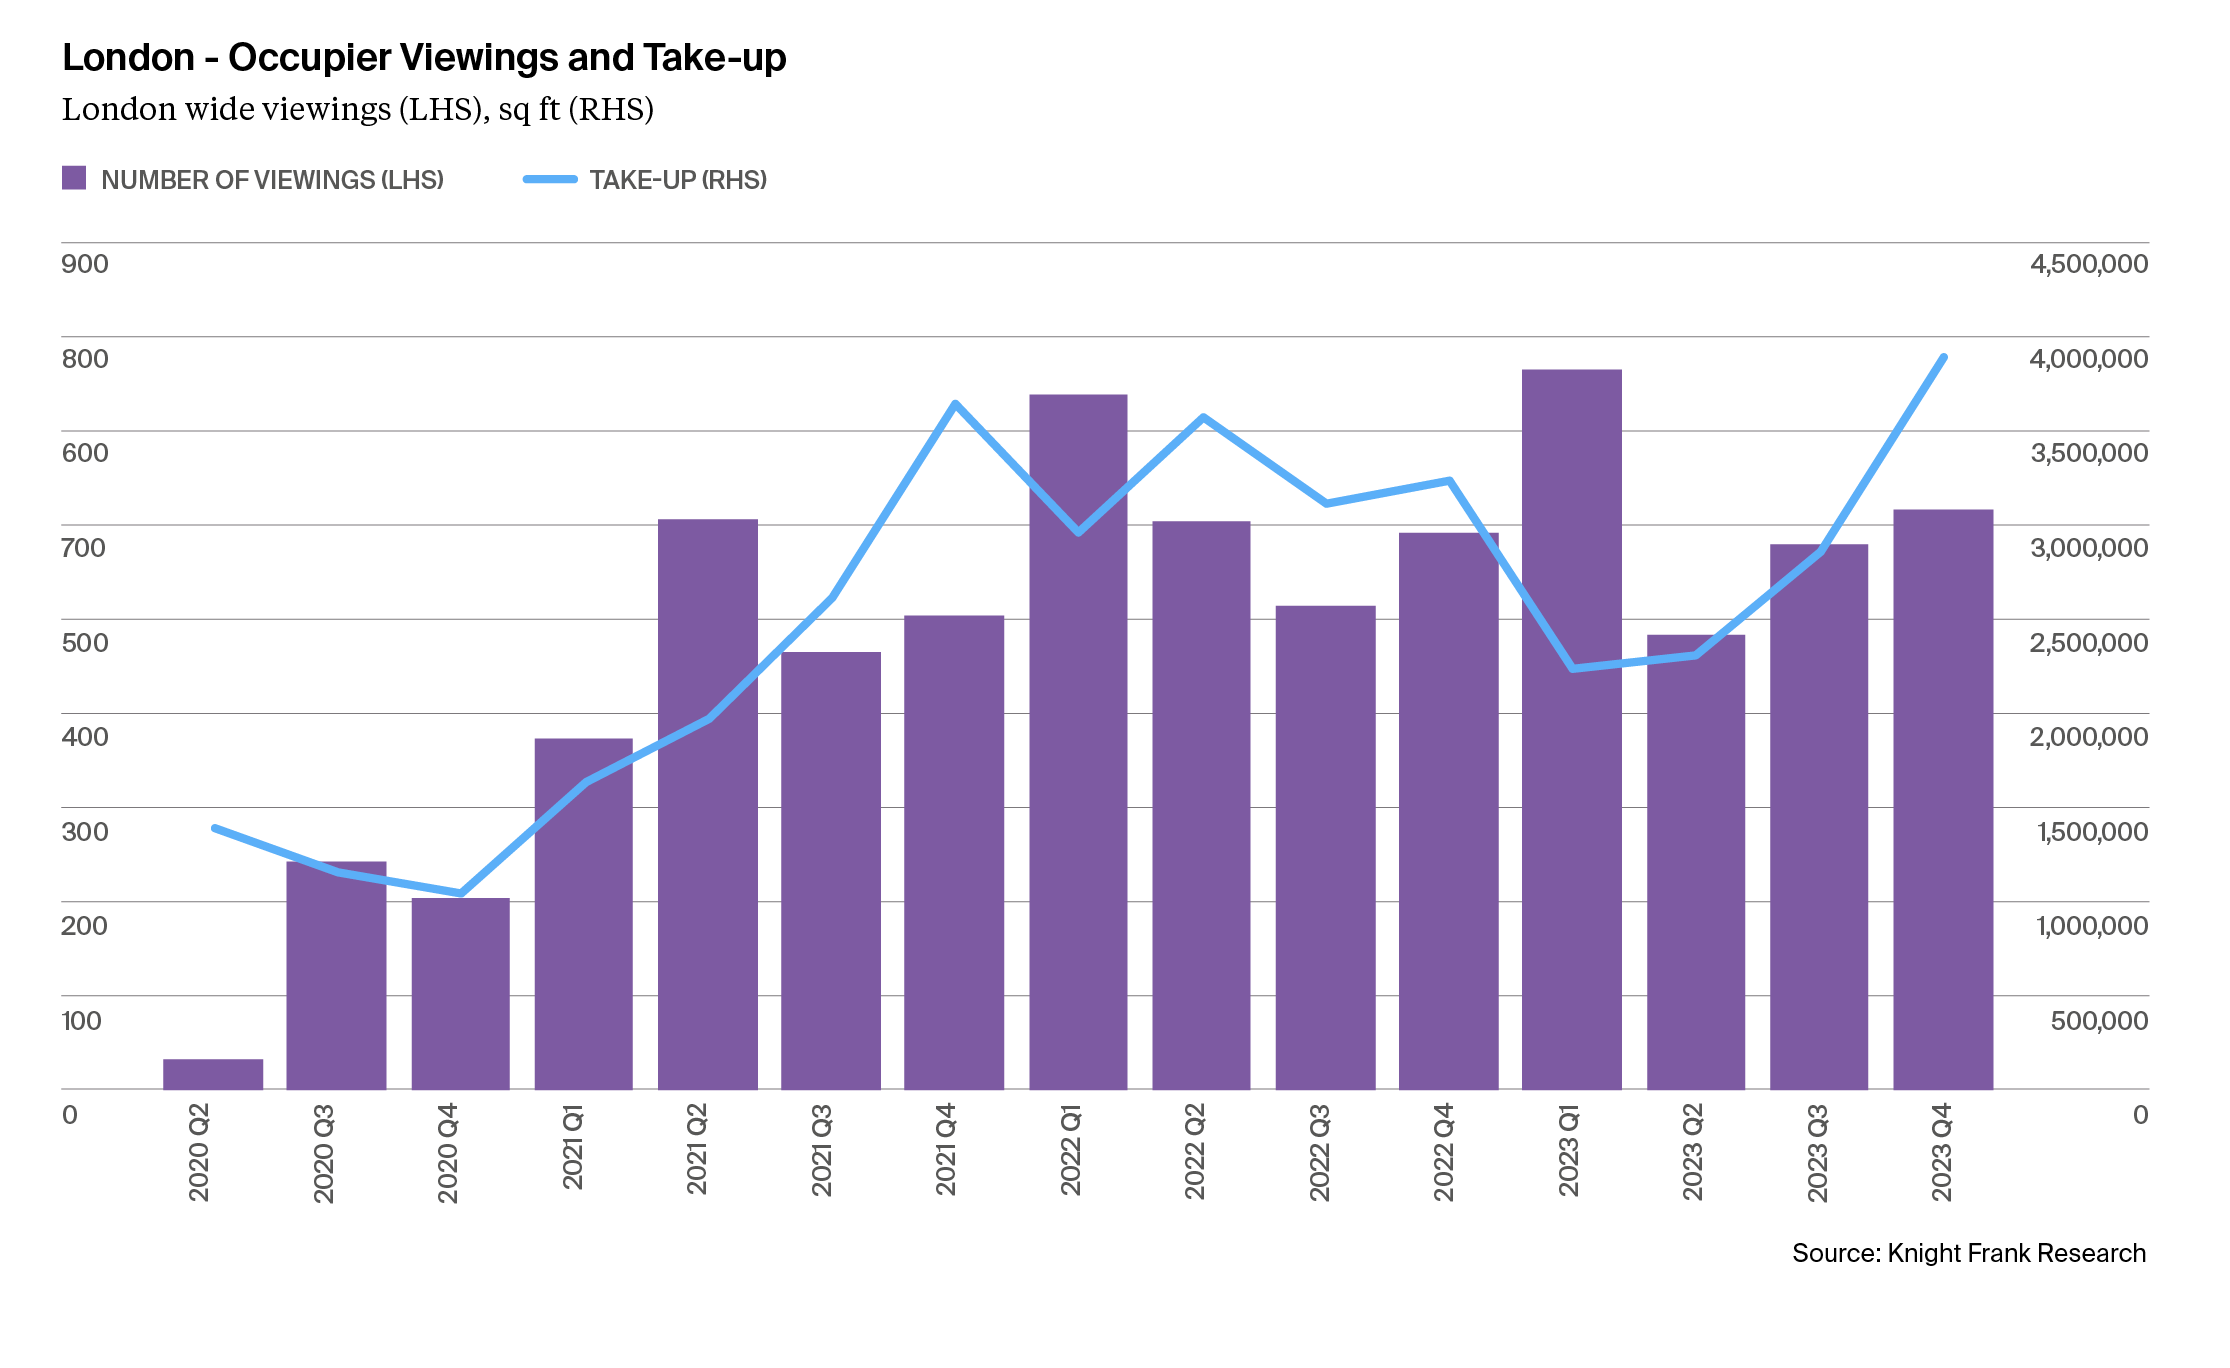
Further guidance on the direction of travel for occupier demand can be found by comparing our viewings and take-up data. This shows the level of viewings provides a two-three quarter lead indication of take-up. For example, rising viewing figures towards the end of 2022 and the first quarter of 2023 (almost 1400 viewings), correlate with almost 4m sq ft of take-up in 2023 Q4. Following a mid-year easing, viewing figures have improved in the second half of 2023 (1,200 viewings) and should lead to take-up strengthening in the second half of 2024.
We can be further optimistic about a continued improvement to viewings figures in 2024 given expectations of falling interest rates. This will allow corporate decision makers to feel confident about future relocation plans as the capital expenditure required for fit-outs should be lower.
In this paper, we have explored the factors that create a set of market imbalances. These will prevail in 2024 with the market characterised by:
Further market polarisation
Occupier demand for highly sustainable and amenity rich offices has resulted in a market bifurcated by quality. New and refurbished office lettings have grown by 28% since the pandemic whilst secondary offices have fallen by 44%.
Positive net-absorption
Near-term requirements for space are at a 10-year high with just over three-quarters of occupiers seeking to relocate to more space than they currently occupy.
An imbalance between future demand and new supply
We believe the under-construction pipeline, which completes by 2026, is 5.3m sq ft below average levels of take-up of new and refurbished space.
In addition, if recent take-up trends are maintained, the pipeline falls short of catering for demand in mid to high size bands.
The race to pre-let space
Between 2024-26, there are 28.3m sq ft of lease expiries across London. This is more than 2.5 times the level of expected speculative development completions.
"We can be further optimistic about a continued improvement to viewings figures in 2024 as there are expectations of falling interest rates. This will allow corporate decision makers to feel confident about future relocation plans as the capital expenditure required for fit outs should be lower."
A Reset to How We Assess Prime Rents
Over the last two years, there has been significant growth in rents across many of London’s office submarkets.
We have had a closer look at the key characteristics that have driven the outperformance of these prime offices and are amending our methodology for assessing rental levels by incorporating sustainability and amenity provision in the basket of lettings we define as prime.
This has resulted in a significant uplift in prime office rents in many London submarkets and business districts. From £77.50 to £87.50 per sq ft in the City Core, from £70.00 to £80.00 per sq ft in Midtown and from £140 to £150 per sq ft in West End Core. To find out more, read Insight 2.1: Resetting Prime Rents.
The London Series - Insight 2: What Drives Leasing Out-Performance? from Knight Frank on Vimeo.