The aim of our Sustainably Led Cities research is to help investors understand how the cities they are investing into might influence their benchmarking and risk outcomes.
We focus on the environmental rather than social aspects of city sustainability, distilling over 500 variables across 286 global cities, scoring their emissions trajectory (brown sub-score); carbon mitigants (green sub-score); climate risks; and urbanisation pressures, which can be combined into an overall sustainably led cities score.
"London, Paris, New York, Seoul, and Tokyo sit as the top five global sustainably led cities."
Based on our unique index of the considerations most applicable to real estate investors, London, Paris, New York, Seoul, and Tokyo sit as the top five global sustainably led cities.
These cities benefit from a range of factors, such as declining carbon emissions per person; well-developed public transport networks; and a relatively high number of green-rated buildings.
For example, London has almost 3,000 BREEAM-rated commercial assets. It is also notable that all of these cities also have universities which are benchmarked against the UN Sustainable Development Goal 11, the strength of research into and contribution to sustainable cities and communities.

However, while all of these cities are making strides in supporting carbon reduction – at least on a relative per person basis – they are not immune to climate risks, as we have seen over the last year.
In fact, globally, none of the 286 cities surveyed scored much above six out of ten for resilience against the impacts of climate change, such as extreme weather events.
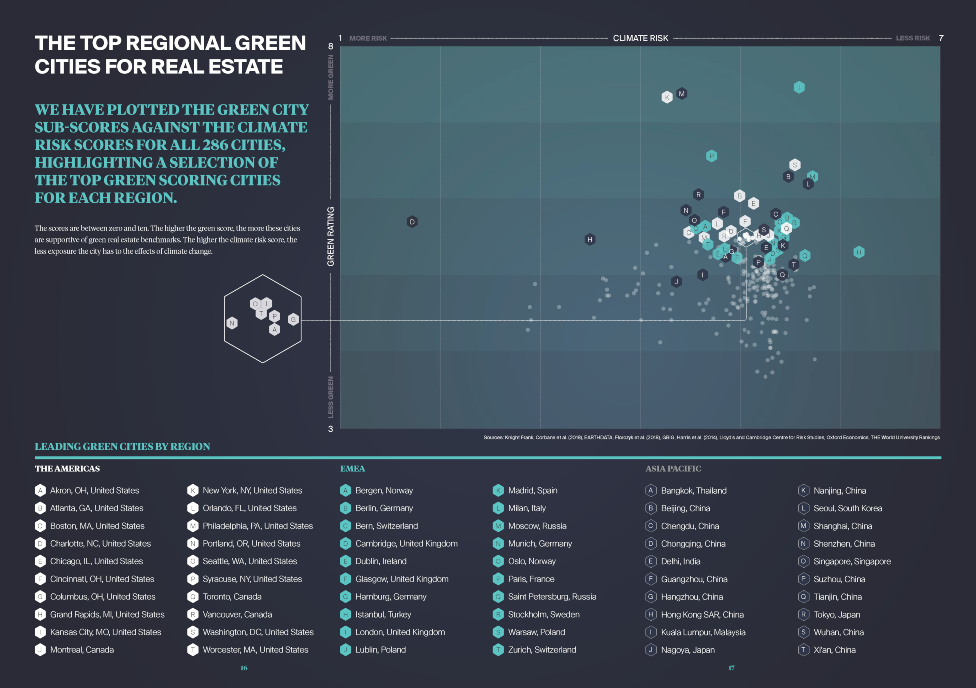
Some regions are impacted more than others, with cities in the Asia-Pacific region facing some of the higher levels of climate risk. However, the story is not that simple, as many cities and buildings in this region are adapting to the risk of these events.
The conclusion here is that investors, almost universally, need to be accounting for the prospect of increased weather events and climate change, and the resulting impact on their portfolios.
The underlying components of these scores are closely aligned to what investors are interested in when benchmarking their portfolios and individual buildings.
"The conclusion here is that investors, almost universally, need to be accounting for the prospect of increased weather events and climate change, and the resulting impact on their portfolios."
For example, when considering the sustainability of a building, it is not just the building itself, but where it is located and what surrounds it, such as the availability of public transport, reflected in the green sub-score.
By also including the number of green buildings in the green sub-score, this highlights those cities with an established market of investible green assets as well.
The highest-scoring ‘green’ cities, London, Shanghai, New York, Paris, and Washington DC are truly global, highlighting that regardless of geographic focus, there are cities across the world which can support investors’ sustainability strategies.
Click to enlarge image
We have plotted the green city sub scores against the climate risk scores for all 286 cities, highlighting a selection of the top green scoring cities for each region. The scores are between zero and ten.
The higher the green score, the more these cities are supportive of green real estate benchmarks. The higher the climate risk score, the less exposure the city has to the effects of climate change.
The story behind the data
There are four parts to the methodology. Firstly, determining the appropriate cities to consider for real estate investors; secondly, undertaking an extensive meta-analysis where we reviewed a large number of city sustainability indices and real estate benchmarks; thirdly, sourcing and cleaning potentially relevant variables; and finally, running the econometric analysis to determine the most representative sustainably led cities score.
Our research covers the most relevant 286 cities across the globe, narrowed down from a long list of 750. All these cities are of a minimum size and have sufficient transactional evidence to be potentially relevant to real estate investors.
We undertook the meta-analysis by reviewing other non-real estate specific sustainable city indexes, as well as different real estate ESG benchmarking tools, in addition to what major investors are considering when benchmarking their portfolios and assets against the ‘E’ of ESG or carbon-reducing specific criteria.
The purpose of this step was to create a score that more specifically supports investor strategy and client benchmarking, than a more general green city index.
On the basis of this meta-analysis, we collected circa 500 variables for each city ranging from the number of green-rated buildings to the proportion of urban area exposed to flood and storm surge risks.
We then used exploratory factor analysis to reduce these down into the most relevant 21 variables, which combine across four sub-categories to create an overall sustainably led cities score. Each of the sub-scores and total scores are between 0 and 10, with 10 being the best outcome and 0 the worst.
The four sub-scores are:
Brown
This is a measure of the change in emissions and resource-use per person over time, as well as the degree of green space within the city. A higher ‘brown’ score suggests that a city has lower total emissions and/or is benefitting from a reduction in emissions per person. Rapidly growing cities may find their emissions per person reducing, even if overall emissions are increasing.
Green
This includes initiatives reducing climate change, such as the size of the local metro network, the amount of green space, the number of green-rated commercial buildings and the number of universities benchmarked against the UN Sustainable Development Goal 11, related to supporting safe, inclusive, resilient and sustainable cities.
Climate risk
This considers changes in precipitation, temperature, extreme weather events, and estimated exposure to weather and climate-related disasters. The higher the score, the less exposed the city is to climate risk.
Urbanisation pressures
This measures the degree of urbanisation and population growth. The higher the score, the less pressure the city faces from rapid growth. Most high scoring cities are large both in terms of population and area and relatively more established.
Download Active Capital 2021
----
Sources
Knight Frank, Corbane et al. (2018), EARTHDATA, Florczyk et al. (2018), GBIG, Harris et al. (2014), Lloyd’s and Cambridge Centre for Risk Studies, Oxford Economics, THE World University Rankings