The drivers of overseas real estate investment into Africa
New research from Knight Frank’s data science team provides an insight into who is investing in the continent’s real estate markets.
3 minutes to read
Real estate data is difficult to obtain across different markets in Africa, and real estate transaction data is even harder to come by.
In order to better understand the impact of the Covid-19 pandemic on countries’ ability to attract real estate investment, the Knight Frank data science team created an econometric model to analyse the key determinants of real estate foreign direct investment (FDI) into African countries between 2015 and 2019, and to further determine the relationship between real estate FDI flows and gross yields across different markets in Africa.
Determinants of real estate FDI
So, what are the factors influencing the amount of real estate FDI an African country receives? Using data from fDi Intelligence, we focused on identifying the main drivers behind variations in real estate FDI flows.
These were categorised in terms of economic and demographic factors, including assessments of economic freedom and progress, using data sourced from Oxford Economics and The Heritage Foundation. Based on this analysis, we ranked the following significant determinants of the inflow of real estate investment to an African country:
Rank
1. Foreign direct investment, US$
2. Judicial effectiveness
3. Financial freedom
4. GDP per capita, real, US$, constant prices
5. Property rights
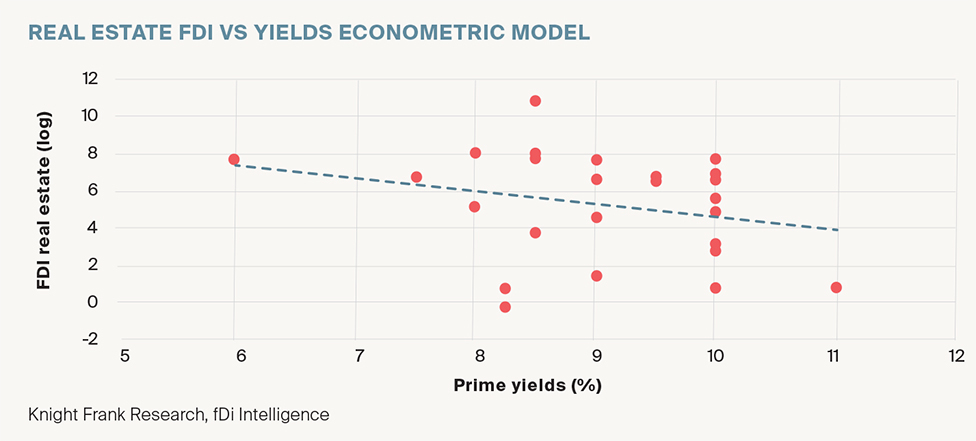
Influence on yields
To understand the relationship between gross yields and real estate FDI received in a country, we grouped the results of the analysis above into three groups of countries: those where the model predicted the amount of real estate FDI almost correctly; those where the model under-predicted the amount of real estate FDI; and those where the model over-predicted the amount of real estate FDI.
We then looked at whether there were significant differences between the prime yields of the countries in these three groups. The results strongly suggest that the relationship is a negative one. Broadly put, as gross yields increase, so does the amount of real estate FDI.
When we compare the three groups, we get these results:
Group - Average prime yield
Model predicted accurately - 8.2%
Model over-predicted - 9.2%
Model under-predicted - 9.8%
In countries where there is a strong, stable real estate investment market and hence low yields, the amount of real estate FDI is approximately what you would expect based on key drivers such as total FDI and GDP per capita.
Countries that have high yields received higher levels of real estate FDI than might be predicted based on the drivers identified in the model, as the returns that could be expected from real estate in those countries are seen as justifying the additional risk.
Countries that do not have such strong and stable real estate markets, but where yields are also not that high, receive less real estate FDI than expected as investors would rather invest in a stable market or one that offers the potential for higher returns.
For example:
Ethiopia recorded prime yields of 6% in 2019. The actual real estate FDI into the country was US$2,000m while the model predicted US$2,900m.
Senegal recorded prime yields of 10% and an actual real estate FDI of US$2,000m compared with predicted real estate FDI of almost nothing.
Nigeria recorded prime yields of 9.5% and an actual real estate FDI of US$650m, compared with a prediction of US$5,800m.