What has the Global Financial Crisis taught us about future investment?
A retrospective examination could indicate what the coming months have in store.
5 minutes to read
Looking back to look forwards, we analyse the trends of the Global Financial Crisis (GFC) of 2008. What lessons can we take to predict future investment activity?
1: Smaller lot sizes were resilient
During the GFC, most liquidity was in $10-100m lot sizes. Smaller transaction activity (sub $100m) declined by the smallest percentage (60%) from the peak to trough of transactions.
The $10-$100m also continued to be the largest proportion of transaction activity during 2008 and 2009. Conversely, the largest transaction sizes of $750m+ declined from record activity of $150bn in 2007 to just $18bn by 2009.
In 2021, investment activity in this largest size bracket had its most active year since 2007, with predominantly office and residential assets traded. From looking back to the GFC, we expect less activity at this size in 2023.
(Sources: Knight Frank Research, RCA)
2: Domestic activity dominated
EMEA-based investors increasingly stayed at home in 2009, recording a decline of 81% in cross-border activity from 2007 versus a relatively more muted decline of 52% in domestic activity.
While cross-border activity was the modus operandi for EMEA-based investors in 2007, by the 2009 trough, domestic activity ($81bn) was more than twice that of outbound capital ($35bn). APAC cross-border capital was relatively nascent on the global scene prior to the GFC.
In 2007 APAC outbound capital was less than half of the outflows seen in the recent 2017 peak of activity. While we may therefore see a reduction in activity from APAC, it is unlikely to revert back to GFC levels. The relative cost of debt advantages, such as those enjoyed by Japan as well as the strengthening of APAC currencies, particularly against the euro and sterling could also support west-bound flows over the coming year.
US investors largely closed shop during the GFC, with both domestic and cross-border activity registering an 86% decline from peak to trough in the GFC. However, the strong US dollar and evidence of dry powder to deploy means that we are likely to see certain US cross-border investors more active over the coming year compared to during the GFC.
3: Focus was on individual rather than portfolio deals
Recent record levels of portfolio deals could be replaced by a focus on individual asset transactions. $546bn of portfolio deals were transacted in 2007, declining to $70bn in 2009 with a switch to individual asset activity. 2021 recently saw the second-highest period for portfolio activity at $541bn.
Again, the focus of the coming year will likely revert to individual deals, although we may see an increase in regional M&A activity in some locations.
4: Private capital and the charities and education sectors were relatively resilient
Private (HNWI) capital, third sector investors and owner occupiers rose to the fore during the GFC. Institutional activity declined by over 90% during the GFC, with domestic private (HNWI) buyers, third sector investors and owner occupiers most active during the 2009 trough. We expect private capital to be an important source of demand over the year ahead.
While a small overall proportion of transactional activity, other investors, for example, owner occupier, but also the third sector – charities and educational establishments, showed largely unique inertia in activity between 2007 and 2008, followed by a relatively small decline in activity of 20% going into 2009. We could see similar activity in the year ahead. Private equity actors are also likely to be waiting to deploy capital opportunistically.
"Private equity actors are likely to be waiting to deploy capital opportunistically."
What it all means now
The outlook for the lending markets will be particularly key to activity levels next year. Currently, we don’t foresee something akin to the shock of the Lehman collapse, which is what precipitated the more significant GFC commercial real estate re-pricing.
The lending market is more diverse, if complex than prior to the GFC. Elevated swap rates are challenging and will likely contribute to polarisation of real estate performance as debt financed in 2018, or extended through the pandemic, comes to maturity. In this environment, there will also be opportunities for solutions such as equity injections or joint ventures as well as new debt funds.
Previous shifts in real estate pricing
Over previous cycles, significant shifts in real estate pricing and demand were driven historically by one or more of the following:
1. Undercapitalised banks
Banks are now much better capitalised. While we have seen an increase in non-bank lenders, they have yet to become a majority of the market.
2. Over-leverage
Compared to the sometimes 100%+ LTV loans seen before the GFC, typical leverage is lower. With the potential for a correction in pricing in some markets, LTVs could lift. However, based on a survey from Preqin, only circa 15% of investors surveyed foresee a significant price correction, with the most common answer being that there is only ‘some’ room for a correction, which has already been seen in many global markets.
3. Over-supply
Increasing uncertainty and material cost inflation has reduced development across many locations, which could reduce supply in the medium term. However, investors should be aware of local potential over-supply imbalances in local markets.
4. Sentiment
Double-digit inflation, slowing growth and energy disruptions could see sentiment wane, driving markets into a self-fulfilling prophecy. Investors able to look beyond this sentiment may find thinner markets offering upside.
Overall, 2023 is likely to see an increased focus on smaller lot sizes, domestic activity, and a refocus on private and other investors. However, institutions, particularly private equity, will still be waiting in the wings.
Many investors have also not yet reached their target real estate allocations. Private sector pension funds have a shortfall of around $29bn (source Preqin), US Endowment plans have an estimated shortfall of $5.5bn, Chinese wealth managers $1bn and Asset managers in the Netherlands an estimated $16bn. Some may use the next 18 months to increase their allocations.

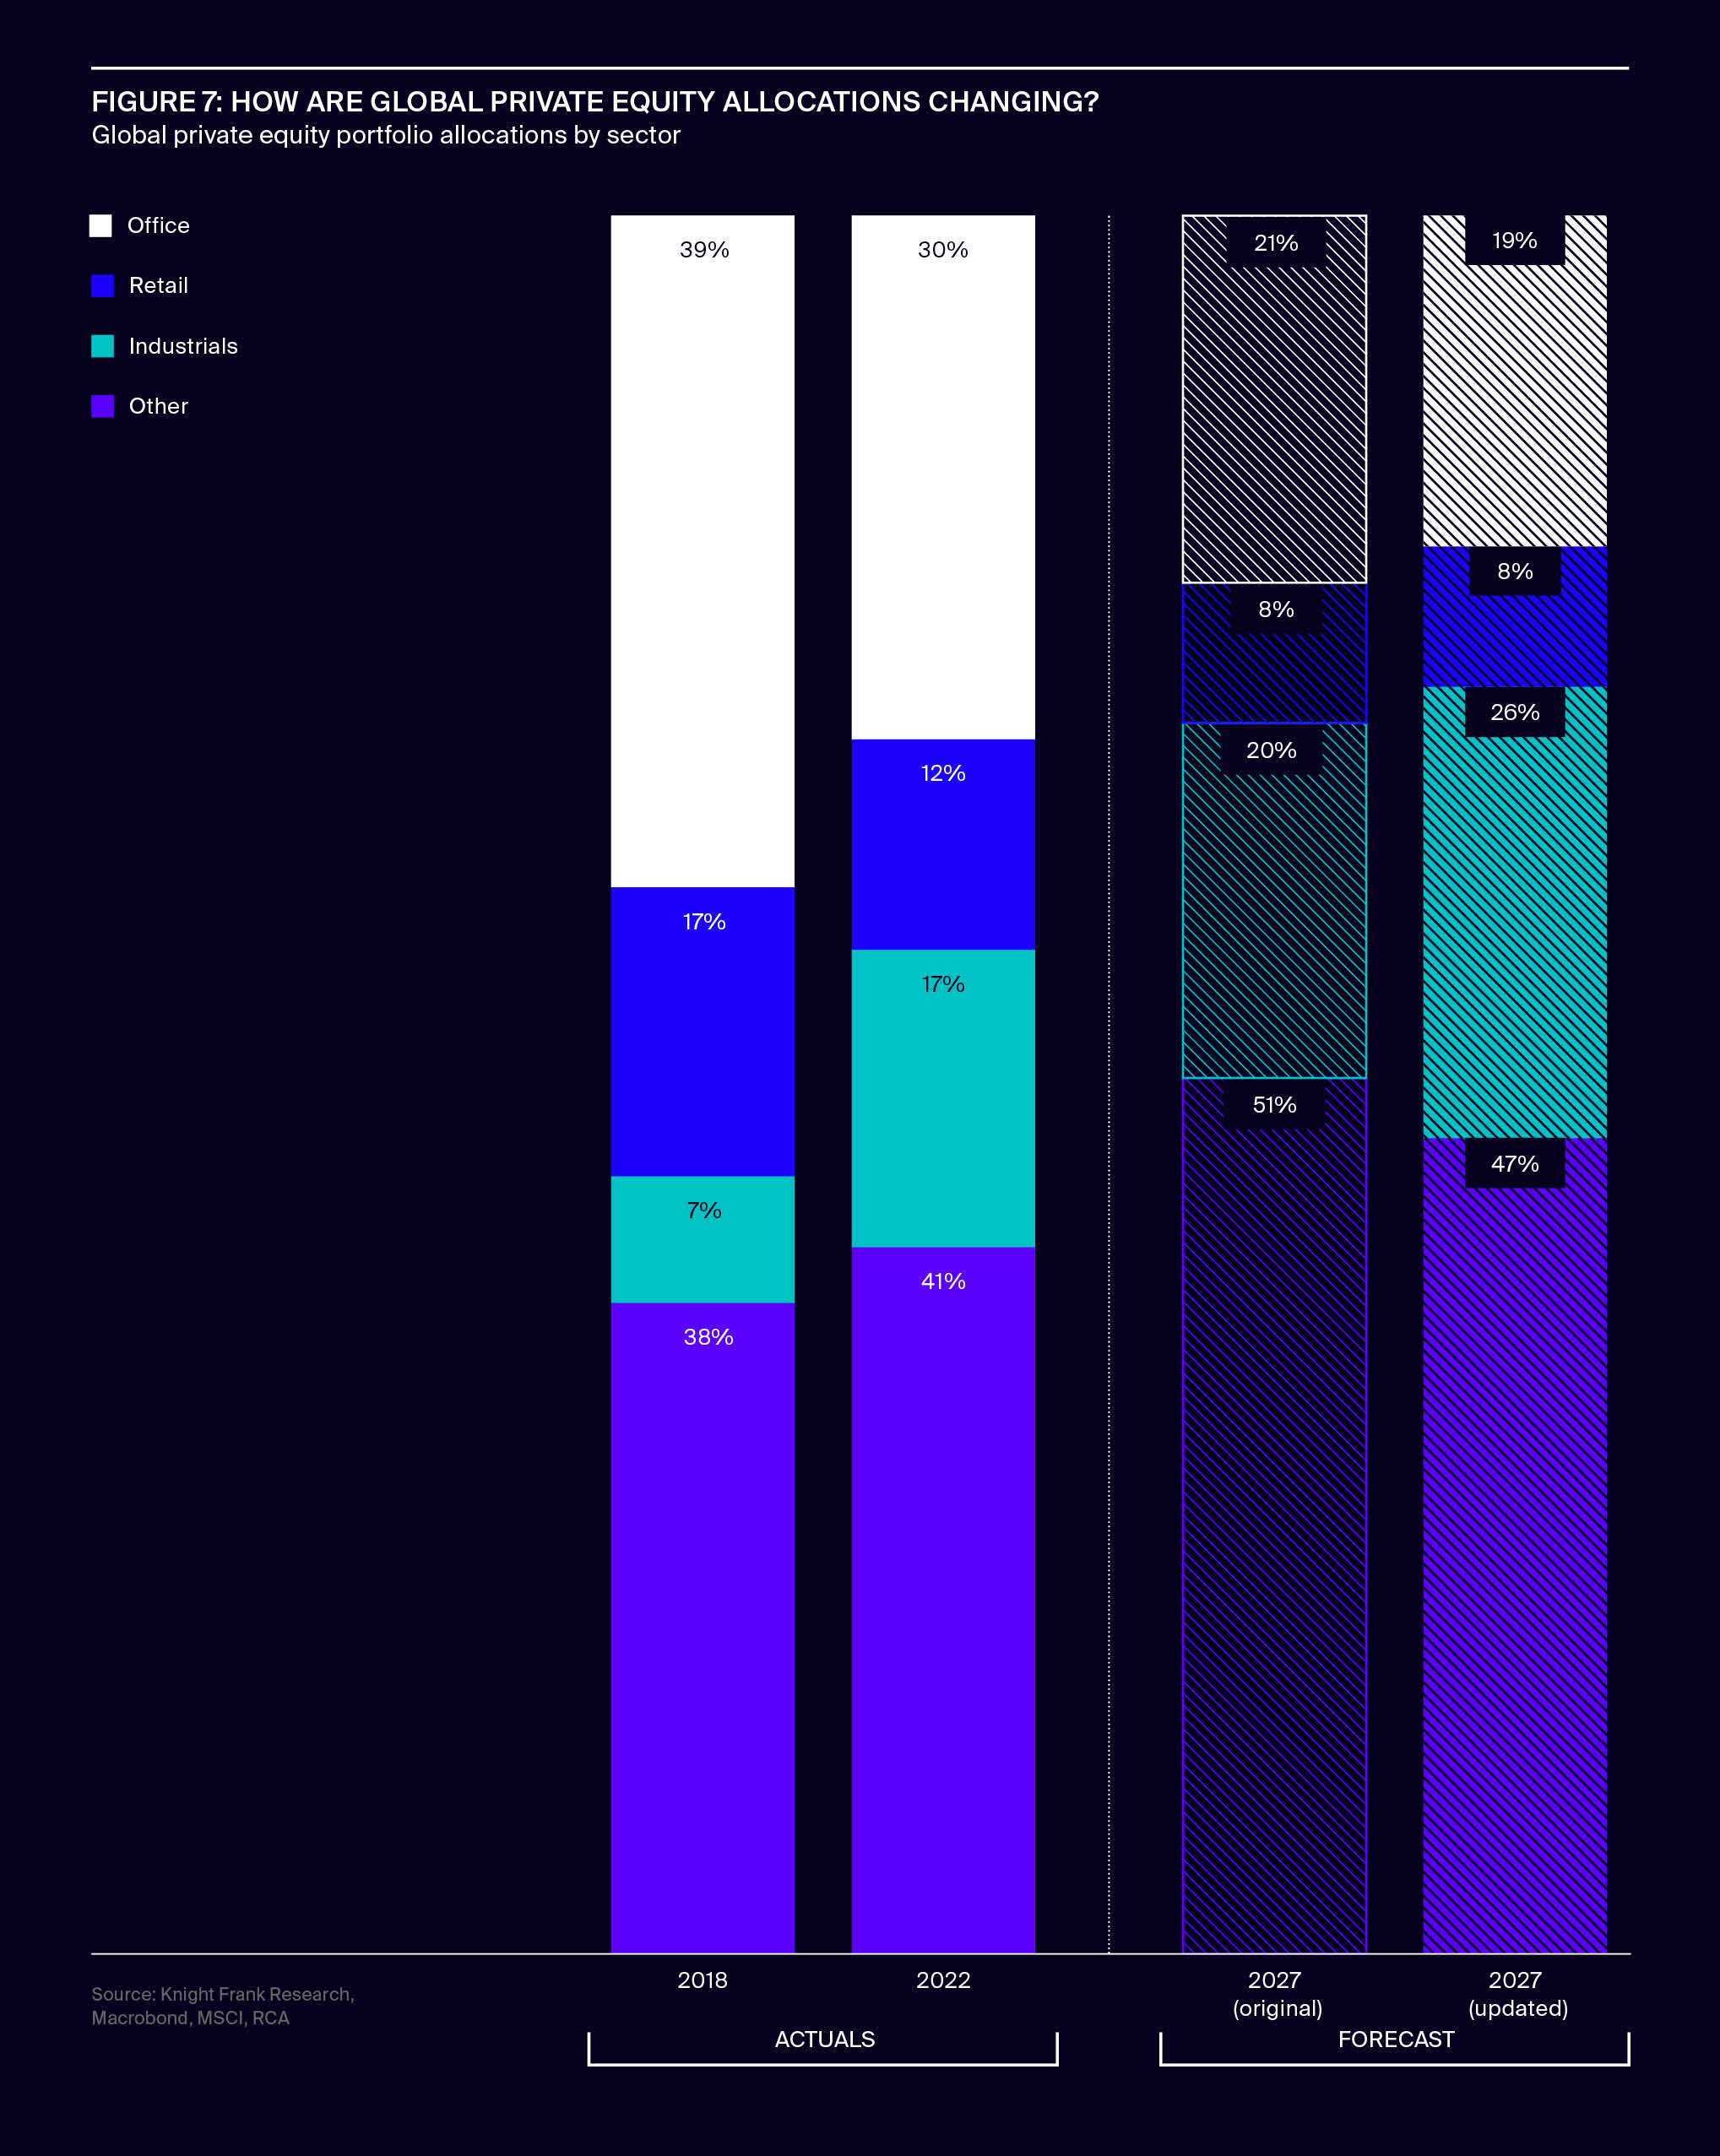
How are investor allocations changing?
Private equity is a leading indicator of how other investors may change their allocations, and in Active Capital 2019/2020, we forecast potential market changes. As Figure 7 below shows, we forecast an increase in ‘other’ (residential) non-traditional sectors (47%) for global private equity portfolios. 2022 has already seen a 10% increase in the industrial sector and a decline in office and retail sectors.
Re-running our allocation forecasts, we see minimal changes to our predictions of office and ‘other’ sector allocations, but we now forecast that the industrial sector could make up one quarter rather than one-fifth of global private equity allocations by 2027.